
A high-risk, high-reward strategy in real estate

Key points
- The real estate sector has sold off hard in recent weeks
- The good news is that the sector will soon enter a favorable seasonal period
- The bad news is that the sector is tightly tied to the economy (with a lot of dark clouds overhanging)
- For an investor willing to accept an above-average level of risk, there may be an opportunity
The real estate sector is plunging
The chart below (courtesy of AIQ TradingExpert) displays an iShares U.S. Real Estate ETF (IYR) bar chart. This ETF recently lost over -14% in just over a month.
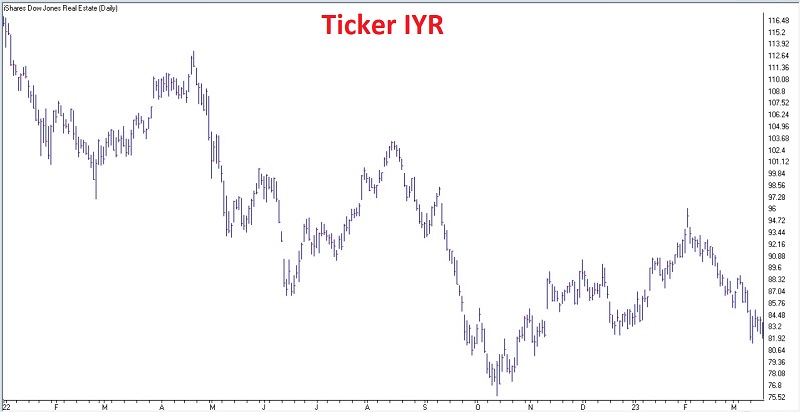
In reality, this index may have understated the damage done to lesser-known and lower-grade REITS. And that fact may set the stage for an opportunity for investors willing to tolerate a higher degree of risk. The biggest concern with this sector is that it reasonably fits in the "trying to catch a falling safe" category. Investors willing to consider a higher-risk trade may take some comfort in the knowledge (hope?) that the sector will soon enter a more favorable seasonal period.
The chart below displays the annual seasonal trend for ticker IYR. Note that the seasonal trend will bottom on Trading Day of Year #56. A favorable period then extends through at least TDY #81. For 2023 this period extends from the close on 2023-03-23 through 2023-04-28.
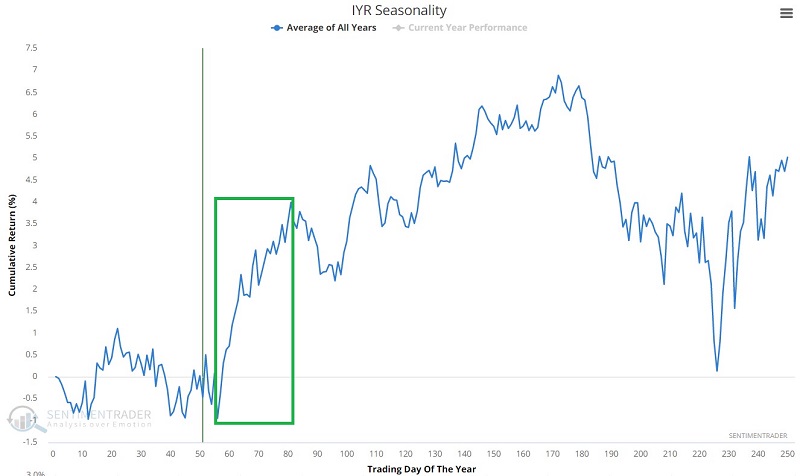
Of course, it is essential to recognize that the chart above is NOT a roadmap. It is merely a depiction of the historical annual tendency. Results during any given year can deviate widely from this average. Nevertheless, for this piece, it gives us some potential reason to think that the recent decline may soon run its course.
Looking at one extreme case
The chart below (courtesy of Optionsanalysis.com) shows an SL Green Realty (SLG) bar chart.
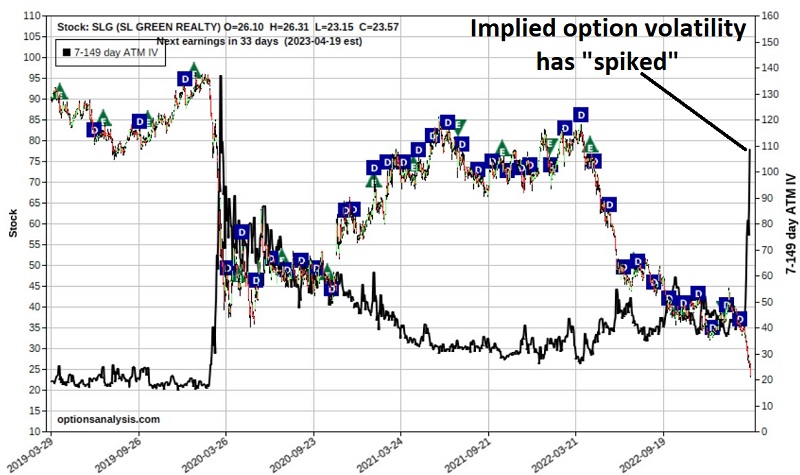
There are three key things to note about this stock:
- It has been extremely hard hit. Since January 2022, SLG is down -72%, including a -47% plunge in just the past six weeks
- The implied volatility for options on SLG has exploded higher. The average option IV has risen from under 40% to over 100% (this tells us that there are presently near-record levels of time premium built into the price of options for this stock)
- It is now offering a very high dividend yield (the current indicated yield for SLG is 13.8%). This alone might begin to make this stock attractive to investors seeking high yields
Does any of this mean that it is time to buy SLG? Interestingly, that is not the argument being made here. The question is, "is there a way to take advantage of the recent spike in option implied volatility, and if so, what are the potential risks and rewards?"
Formulating a strategy
The first step is assessing the company under consideration, with a twist - which we will get to in a moment. SL Green (ticker SLG) is the largest Manhattan property owner and landlord, with interest in around 35 million square feet of wholly owned and joint venture office space. The company has additional property exposure through its limited portfolio of well-located retail space. It operates as a real estate investment trust.
According to Yahoo Finance:
Manhattan's largest office landlord today (March 20), announced that its board of directors has declared a monthly ordinary dividend of $0.2708 per share of common stock, which is the equivalent of an annualized dividend of $3.25 per share. The dividend is payable in cash on April 17, 2023, to shareholders of record at the close of business on March 31, 2023.
The good news is that the stock is much cheaper than a month or a year ago, and the annualized dividend yield is roughly 13.8%. The bad news is there is no way to know when or at what price the sell-off will end, and are plenty of reasons to question the future of Manhattan commercial office space and the long-term prospects for SLG.
But this is the most crucial distinction: No one advocates buying the stock today. The question being posted here is not, "should I buy this stock today?" The questions to ask (as we will see in a moment) are "am I willing to bet that this stock will NOT drop another -36% in the next 35 days" and "if it does fall that far that soon, am I willing to buy it then, knowing that the dividend yield at that time would be more than 20%?"
Formulating a trade
It must first be noted that the trade example that follows is not a "recommendation." The danger associated with playing the long side of this stock in any form is very high. While one can argue that SLG is technically oversold and that real estate seasonality may turn more favorable soon, there are zero guarantees that this stock will not continue to fall hard indefinitely. Nevertheless, for an investor willing to bear that risk, some decent opportunities may be available, thanks to the fact that option premiums are exorbitantly high.
The strategy we will consider is referred to as selling a cash-secured put. We will sell an out-of-the-money put option and collect the option premium. The present high implied volatility (IV) guarantees we will collect top dollar for selling the put option. To enter this trade, we will need to have enough cash in our account to ensure that we can buy 100 shares of stock (per put option sold) at the strike price of the option sold if the stock price falls below the option strike price and the option is exercised (thus requiring us to buy the stock).
From there, one of several things will happen:
- The price of the stock never touches the put option strike price, and we keep the entire premium (earning an above-average rate of return)
- The stock price will fall below the put option strike price, and we will buy 100 shares. If this does happen, it means we will be buying the stock at a price far below where it is now, and the dividend yield at that time will be extraordinarily high
- The other possibility is that we buy back the option before expiration (or exercise) and incur a profit or a loss depending on the price we pay to buy it back
Cash secured put on SLG
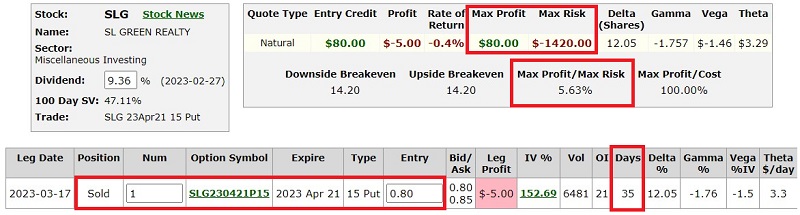
Our example trade for SLG involves:
- Selling the Apr21 2023 15 put at $0.80
The particulars for the trade appear in the screenshot below.
The risk curves (i.e., the expected profit/loss at a given price for SLG stock as of four different dates) appear below.
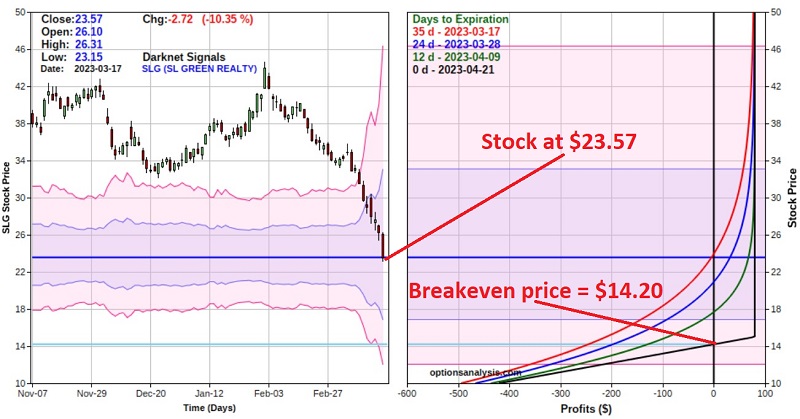
Things to note:
- As this is written, SLG stock is trading at $23.57 a share
- There are 35 calendar days left until the Apr21 2023 options expire
- We sell the 15-strike price put, so we must have $1,500 in our account in order to guarantee that we can buy 100 shares of SLG if the stock is put to us. This amount can include the $80 option premium we receive for selling the put option. So the maximum risk is $1,420 (the maximum risk would only be incurred if we were required to buy the stock at $15 a share and the stock ultimately went to 0 while we were still holding the shares)
- We receive $80 for selling the put option, so if the option expires worthless, our return would be 5.63% in 35 days ($80 income/$1,420 risk)
- The stock must fall another -36% from 23.57 to reach the strike price of $15 (i.e., this trade is a bet that the stock won't fall that far that soon)
- If SLG stock does fall to $15 before the April options expiration and the put option is exercised, we will buy 100 shares at $15 a share - however, our effective breakeven price is $14.20 because of the option premium we received when we sold the put
Another thing to note that may make this trade attractive to a particular segment of investors is this: The annualized dividend, as just announced, is $3.25. If we buy the shares at an effective price of $14.20, the dividend yield at the time would be roughly 22.9% (barring a cut in the dividend - it is up to the investor to explore the likelihood of a dividend cut before making a trade).
In a perfect world, our two potential outcomes are collecting a 5.63% yield in just over a month (if the option expires worthless) or buying a presumably undervalued stock with a monstrous dividend yield (if the option is exercised). But again, the risks that the investor takes on are the risk that the stock continues to fall much farther in price and/or that the dividend gets cut somewhere along the way.
One additional caveat
The reality is that the example trade highlighted above will have zero appeal to the majority of investors and a great deal of appeal to a particular group of investors. One additional caveat for that group of investors appears in the chart below. The red dots highlight when our Optix indicator for ticker SLG has dropped below 1%, as it did most recently on 2023-03-17.
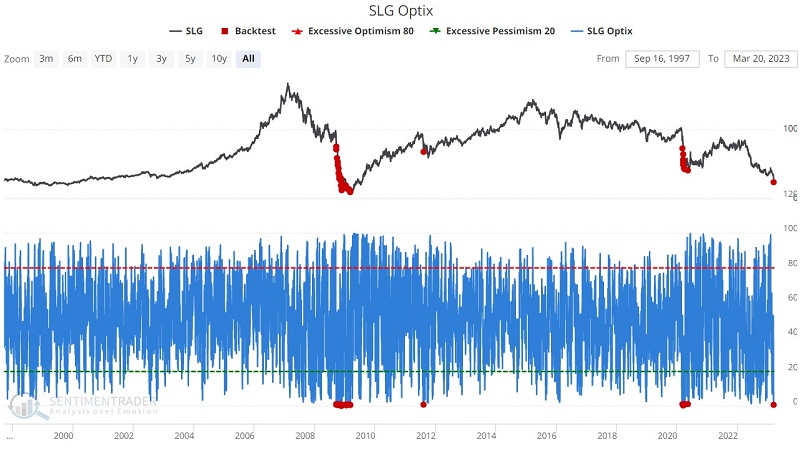
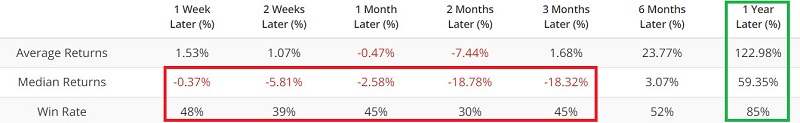
As you can see in the chart above, one red dot was not enough to slow this volatile stock's rate of descent during previous instances. On the other hand, the numbers in the table above might look advantageous to an investor looking to accumulate shares in high-yielding stocks. Note that while SLG was higher three months later only 30% of the time, the one-year results show a Win Rate of 85% with a whopping 59% median return. Also, note that the median 1-month return was -2.58%. Remember that with the example trade above, if SLG does anything other than decline -36% or more in the next 35 calendar days, the trade earns 5.63%, and the capital committed to the trade ($1,420) is released to pursue other opportunities.
This example is the textbook definition of a high-risk, high-reward situation.
What the research tells us…
Buying stocks that are in freefall is fraught with peril and is typically not a recommended strategy. Also, selling naked put options has appeal to a limited segment of the investing population. Nevertheless, opportunity is where you find it. For those willing to take an above-average risk, the example trade above offers the potential for earning 5%+ in just over a month (if the stock does not plunge another -36% in the next 35 days) or buying a stock with a 20%+ dividend yield (if the put option is exercised), and also with a history of experiencing significant gains twelve months after investor Sentiment (Optix < 1%) reaches a bearish extreme.