Products
SentimenTrader Trading Tools
‍
Backtest Engine
My Trading Toolkit
Correlation Analysis
Seasonality
Market Prediction
Indicators & Data API
‍
Proprietary Indicators & Charts
Market Data API
Strategies & Scanner
‍
50+ Trading Strategies
Smart Stock Scanner
Smart Option Scanner
Research Reports
‍
Research Solutions
Reports Library
Free Resources
Simple Backtest Calculator
Simple Seasonality Calculator
The Kelly Criterion Calculator
Sentiment Geo Map
Public Research Reports
Education
Sentiment Indicators
Technical Indicators
Pricing
Company
About
In the News
Testimonials
Client Success Stories
Contact
Log inLoginSign up
< BACK TO ALL REPORTS

A High HiLo

Jason Goepfert
2019-11-18
null

This is an abridged version of our recent reports and notes. For immediate access with no obligation, sign up for a 30-day free trial now.


HiLo is high

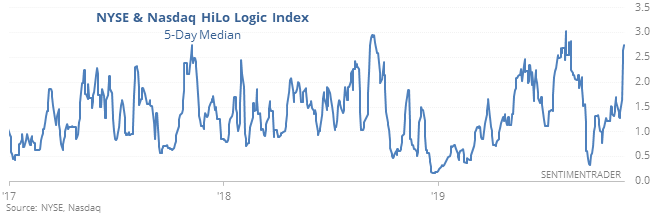
Over the past week, there have been an increasing number of signs of a “split” market, with many winning and losing stocks. That has caused the HiLo Logic Index to spike for the NYSE and, especially, the Nasdaq.

On both Wednesday and Thursday, the Nasdaq triggered double warnings, which as we saw preceded very poor risk/reward ratios for both the Nasdaq and the S&P 500 over the medium-term. Those warnings are based on earlier work from Norman Fosback, who is credited with introducing the HiLo Logic Index.

It is intended as a way to observe "split" market conditions, it looks for times when there are both a large number of 52-week highs AND 52-week lows among securities on the exchange. When there are a lot of both, the market is severely split between winners and losers, and it tends to be a negative for stocks. When there is a very low number, then the market is heavily one-sided, which tends to be a positive for stocks.

For the NYSE, that indicator is climbing. After any time the NYSE indicator was above 2.5, future returns in the S&P 500 were negative up to three months later according to our Backtest Engine. And it’s even more extreme for the Nasdaq.

Over the past 20 years, it has been a mostly effective warning sign.


Steeper and steeper

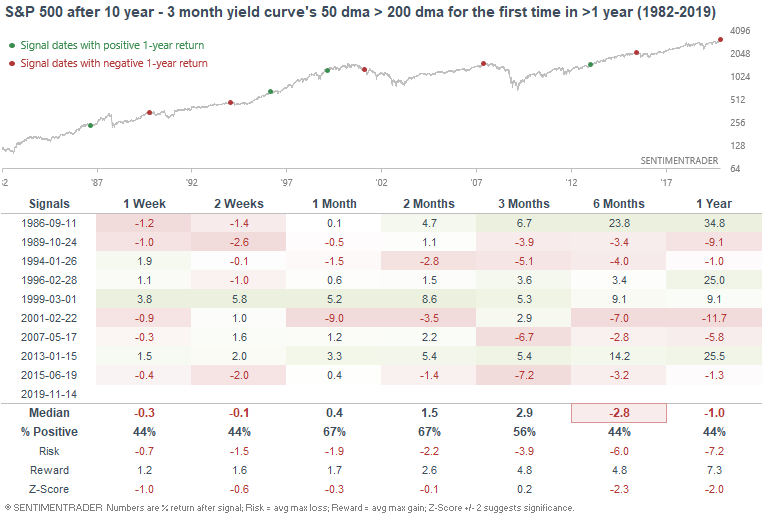
This week I once again looked at the steepening 10 year - 3 month Treasury yield curve, which formed a golden cross for the first time in more than a year:

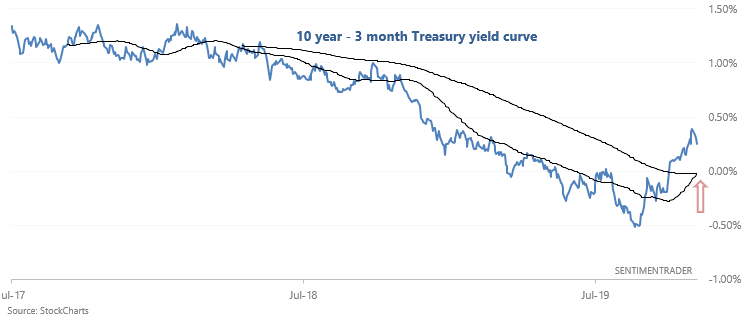
Steepening yield curves aren't great for the stock market, since this often happens during recessions:


We also looked at:

  • The entire Treasury yield curve is positive after > 50% of it was inverted
  • The y/y change in Industrial Production is negative
  • The S&P 500 has held above its 10-day average for nearly 30 days
  • It's also up 6 weeks in a row
  • Chile's stock market has jumped 10% in 2 days
  • The correlation between gold and emerging market currencies has plunged
  • Economic surprises are back to negative
PRODUCTS
SentimenTrader
Trading Tools
Indicators & Data API
‍
Strategies & Scanner
‍
Research Reports
FREE
RESOUrCES
Simple Backtest
Calculator
Simple Seasonality
Calculator
The Kelly Criterion
Calculator
Sentiment Geo Map
‍
Public Research Reports
‍
Education
Sentiment Indicators
‍
Technical Indicators
‍
Pricing
Bundle pricing
‍
FAQ
‍
Announcements
‍
COMPANY
‍
About
‍
In the News
‍
Testimonials
‍
Client Success Stories
CONTACT
‍
General Inquiries
‍
Media Inquiries
‍
Financial Professionals Inquiries
‍
© 2026 Sundial Capital Research Inc. All rights reserved.
Setsail Marketing
TermsPrivacyAffiliate Program
Risk Disclosure: The information and tools provided are for research and analytical purposes only and are not intended as investment advice. Market analysis involves uncertainty, and outcomes may differ from expectations. Users should conduct their own due diligence and consider their individual circumstances before making any financial decisions. Past performance is not necessarily indicative of future results.

Hypothetical Performance Disclosure: Hypothetical performance results have many inherent limitations, some of which are described below. No representation is being made that any account will or is likely to achieve profits or losses similar to those shown; in fact, there are frequently sharp differences between hypothetical performance results and the actual results subsequently achieved by any particular trading program. One of the limitations of hypothetical performance results is that they are generally prepared with the benefit of hindsight. In addition, hypothetical trading does not involve financial risk, and no hypothetical trading record can completely account for the impact of financial risk of actual trading. for example, the ability to withstand losses or to adhere to a particular trading program in spite of trading losses are material points which can also adversely affect actual trading results. There are numerous other factors related to the markets in general or to the implementation of any specific trading program which cannot be fully accounted for in the preparation of hypothetical performance results and all which can adversely affect trading results.

Testimonial Disclosure: Testimonials appearing on this website may not be representative of other clients or customers and is not a guarantee of future performance or success.