Data &
Technology
Research
Reports
Report Solutions
Reports Library
Actionable
Strategies
Free
Resources
Simple Backtest Calculator
Simple Seasonality Calculator
The Kelly Criterion Calculator
Sentiment Geo Map
Public Research Reports
Free Webinar
Pricing
Company
About
Meet Our Team
In the News
Testimonials
Client Success Stories
Contact
Log inLoginSign up
< BACK TO ALL REPORTS

A Gap Down Monday

Jason Goepfert
2016-06-27
null

Stock futures have taken a turn lower and it looks like we'll be seeing a gap down of last least 0.5% before the open on Monday, though that could easily change with such volatile conditions.

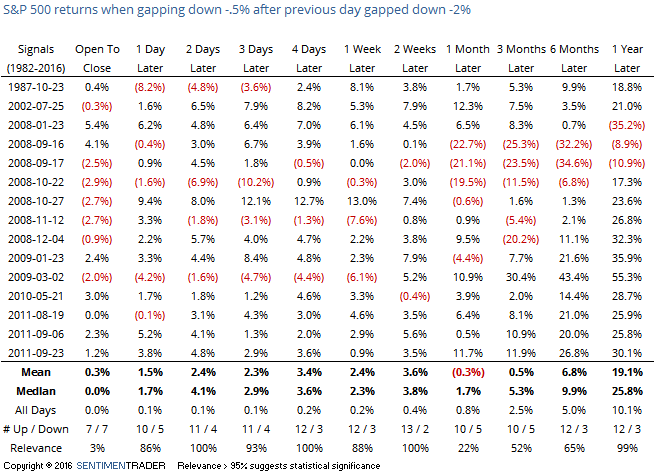
If we do, it will be the 16th time since 1982 that stocks have gapped down at least 0.5% the day after a gap down of at least 2.0%. That suggests a level of emotional trading that is rarely matched.

The table below highlights S&P 500 performance following the open of the second gap down day.

201606127_gap_table

The best performance was two weeks later, with 13 winners out of 15 trades and only one of the losses was of any magnitude. There was some major periods of self-doubt in several of them, as stocks slid in the short-term before recovering over the next couple of weeks.

It happened only twice before on a Monday (2008-10-27 and 2009-03-02), but they led to diverging short-term paths.

If we look at gaps down of 0.5% or more on a Monday after Friday suffered a large closing loss of 3% or more, then we get the following:

201606127_gap_table2

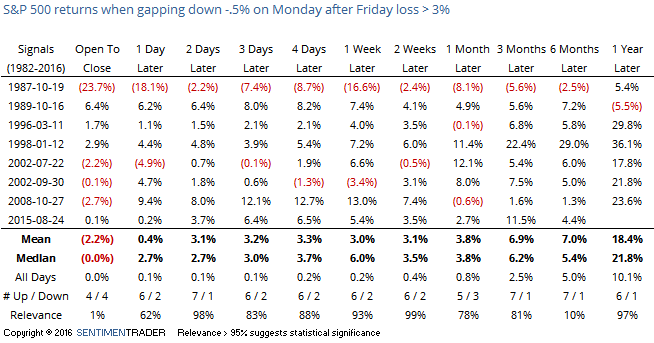
The best short-term results were were over the next two days, as the S&P rallied 7 out of 8 times from Monday's open through Wednesday's close.

One caveat is that Friday saw a negative breadth thrust day, with more than 90% of NYSE volume occurring on the downside. We took a look at the opposite of this kind of thrust coming out of the February low, so it's far to invert this pattern and see how it played out. The following table shows S&P 500 returns since 1940 when it suffered a 10% or lower Up Volume Day when the previous close had been within 1% of a 52-week high.

201606127_volume

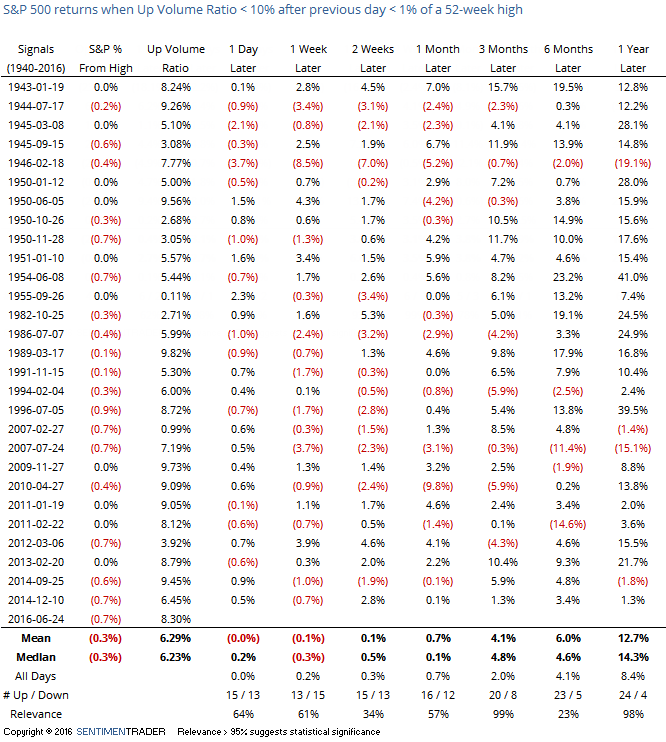
Returns over the next week were poor, with only 13 gains out of 28 instances. Most of the losses were relatively tame, however. By three months later, there were 20 winners and the average return was positive enough to be significant.

When stocks have suffered a large loss on a Friday and then follow through with that loss on a Monday, there is a strong tendency to see a rebound into Tuesday/Wednesday, so we'll be looking for that tendency to occur this week as well. Buying an opening gap on Monday is less reliable, with returns improving if waiting until the close.

Whenever there is a downside thrust like this, there is also a strong tendency to see some testing of the panic low levels in the weeks ahead, so on a multi-week timeframe the bullish argument loses some luster. There is a stronger tendency to see positive returns in the medium-term of a couple of months and longer.

Sorry, you don't have access to this report

Upgrade your subscription plan to get access
Go to Dasboard
DATA &
TECHnologies
IndicatorEdge
‍
BackTestEdge
‍
Other Tools
‍
DataEdge API
RESEARCH
reports
Research Solution
‍
Reports Library
‍
actionable
Strategies
Trading Strategies
‍
Smart Stock Scanner
‍
FREE
RESOUrCES
Simple Backtest
Calculator
Simple Seasonality
Calculator
The Kelly Criterion
Calculator
Sentiment Geo Map
‍
Public Research Reports
‍
Free Webinar
COMPANY
‍
About
‍
Meet our Team
‍
In the News
‍
Testimonials
‍
Client Success Stories
Pricing
Bundle pricing
‍
Announcements
‍
FAQ
© 2024 Sundial Capital Research Inc. All rights reserved.
Setsail Marketing
TermsPrivacyAffiliate Program
Risk Disclosure: Futures and forex trading contains substantial risk and is not for every investor. An investor could potentially lose all or more than the initial investment. Risk capital is money that can be lost without jeopardizing ones’ financial security or life style. Only risk capital should be used for trading and only those with sufficient risk capital should consider trading. Past performance is not necessarily indicative of future results.

Hypothetical Performance Disclosure: Hypothetical performance results have many inherent limitations, some of which are described below. No representation is being made that any account will or is likely to achieve profits or losses similar to those shown; in fact, there are frequently sharp differences between hypothetical performance results and the actual results subsequently achieved by any particular trading program. One of the limitations of hypothetical performance results is that they are generally prepared with the benefit of hindsight. In addition, hypothetical trading does not involve financial risk, and no hypothetical trading record can completely account for the impact of financial risk of actual trading. for example, the ability to withstand losses or to adhere to a particular trading program in spite of trading losses are material points which can also adversely affect actual trading results. There are numerous other factors related to the markets in general or to the implementation of any specific trading program which cannot be fully accounted for in the preparation of hypothetical performance results and all which can adversely affect trading results.

Testimonial Disclosure: Testimonials appearing on this website may not be representative of other clients or customers and is not a guarantee of future performance or success.