Data &
Technology
Research
Reports
Report Solutions
Reports Library
Actionable
Strategies
Free
Resources
Simple Backtest Calculator
Simple Seasonality Calculator
The Kelly Criterion Calculator
Sentiment Geo Map
Public Research Reports
Free Webinar
Pricing
Company
About
Meet Our Team
In the News
Testimonials
Client Success Stories
Contact
Log inLoginSign up
< BACK TO ALL REPORTS

A front-loaded rally as gains peter out

Jason Goepfert
2020-05-06
In the 30 days that stocks have rallied from the March low, gains have been large - historic, even. But almost all of them came during the first 15 days of the rally. In the second 15 days, the S&P 500 has made barely any progress. That raises the potential that buyers have become exhausted. Historically, front-loaded rallies have not performed worse than ones that were more back-loaded.

Since stocks bottomed on March 23, they've shown impressive gains. After 30 days, the S&P 500 was still showing a gain of nearly 30% from its lows.

The trouble (maybe) is that that the rally has been so front-loaded. The first 15 days of the 30-day rally generated virtually all of the gains. While the second 15 days have shown a gain, it was barely positive.

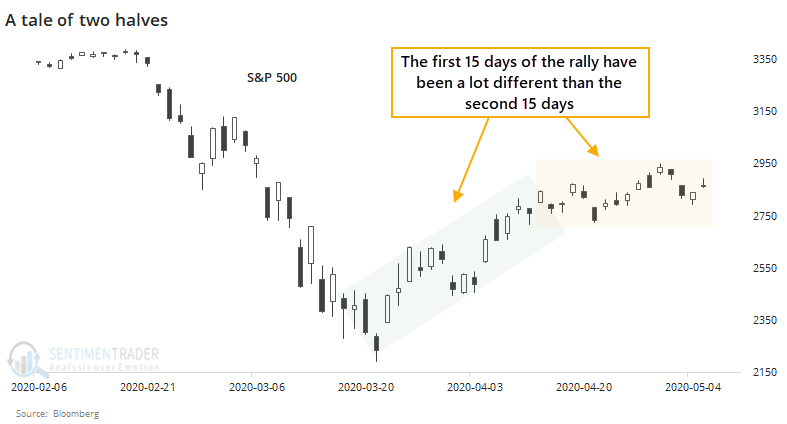
No matter what markets do, there are always boo-birds suggesting that things will fall apart. They're using this first-half, back-half argument now to spin the idea that buyers have run out of juice and we're about to roll over.

So, let's check.

We'll go back to 1928 and look for every time the S&P 500 set a 52-week low, then rallied for 30 days. The gain during the first 15 days of the rally must be at least 3 times greater than the gain during the second 15 days.

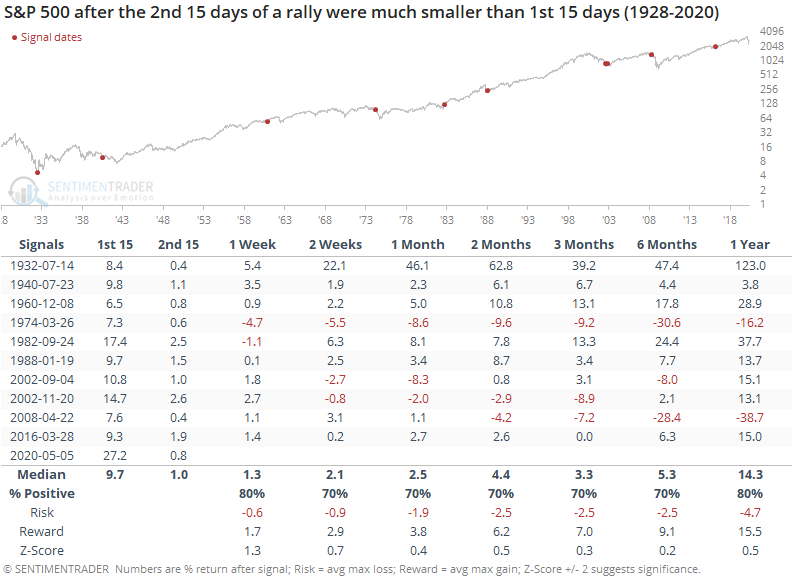
Returns were okay most of the time, but there were two big losers over the next 6-12 months. If the S&P fell back and showed a loss or only a small gain over the next month or so, then that weakness tended to bleed over into longer-term returns as well. Part of that makes sense because the one-year returns include returns during the first month, but there was a long-term difference between the rallies that saw renewed buying interest over the next month and those that didn't.

Now let's look at those 30-day rallies off a low when the second 15 days were more comparable to the first 15 days. 

It's rare to see bigger gains in the second half of a 30-day rally than the first half. And even when we did, it didn't really matter, at least across most time frames.

Over the next two months, the rallies with a weak back half tended to do quite a bit better than the rallies with a more robust second half. The biggest difference was a year later when the rallies with a strong second 15 days averaged nearly 22% and had only a single loss (though that loss was large, from 2001).

Overall, there isn't anything in the pattern to suggest an investor should become more defensive just because the gains have petered out. The biggest caveat would be that if we do roll over from here and show losses over the next 1-2 months, it would usher in some of the more unpleasant longer-term precedents.

Sorry, you don't have access to this report

Upgrade your subscription plan to get access
Go to Dasboard
DATA &
TECHnologies
IndicatorEdge
‍
BackTestEdge
‍
Other Tools
‍
DataEdge API
RESEARCH
reports
Research Solution
‍
Reports Library
‍
actionable
Strategies
Trading Strategies
‍
Smart Stock Scanner
‍
FREE
RESOUrCES
Simple Backtest
Calculator
Simple Seasonality
Calculator
The Kelly Criterion
Calculator
Sentiment Geo Map
‍
Public Research Reports
‍
Free Webinar
COMPANY
‍
About
‍
Meet our Team
‍
In the News
‍
Testimonials
‍
Client Success Stories
Pricing
Bundle pricing
‍
Announcements
‍
FAQ
© 2024 Sundial Capital Research Inc. All rights reserved.
Setsail Marketing
TermsPrivacyAffiliate Program
Risk Disclosure: Futures and forex trading contains substantial risk and is not for every investor. An investor could potentially lose all or more than the initial investment. Risk capital is money that can be lost without jeopardizing ones’ financial security or life style. Only risk capital should be used for trading and only those with sufficient risk capital should consider trading. Past performance is not necessarily indicative of future results.

Hypothetical Performance Disclosure: Hypothetical performance results have many inherent limitations, some of which are described below. No representation is being made that any account will or is likely to achieve profits or losses similar to those shown; in fact, there are frequently sharp differences between hypothetical performance results and the actual results subsequently achieved by any particular trading program. One of the limitations of hypothetical performance results is that they are generally prepared with the benefit of hindsight. In addition, hypothetical trading does not involve financial risk, and no hypothetical trading record can completely account for the impact of financial risk of actual trading. for example, the ability to withstand losses or to adhere to a particular trading program in spite of trading losses are material points which can also adversely affect actual trading results. There are numerous other factors related to the markets in general or to the implementation of any specific trading program which cannot be fully accounted for in the preparation of hypothetical performance results and all which can adversely affect trading results.

Testimonial Disclosure: Testimonials appearing on this website may not be representative of other clients or customers and is not a guarantee of future performance or success.