A Few Important Changes to Seasonal Charts

As I have mentioned on a number of occasions, I am a fan of using seasonality as a tool in market analysis. However, I have also been around long enough to recognize - and readily acknowledge - that the problem with any seasonal trend is that you never know for sure if it is going to work "this time around." So no particular trend should ever be taken as "gospel." If anything, I look at seasonal trends like I do any other indicator - a moving average, an oversold RSI reading, etc. - i.e., it gives you "information". Hopefully, more often than not that information will prove useful, but it is still just one "spoke in the wheel" of decision making.
Updated Seasonal Charts
A seasonal chart can at times provide clues as to what a given stock, market, index or ETF "should be" doing during a given time frame. If a seasonal chart points to a clear expectation, then the trader can decide whether or not to make an actual play in the market to exploit that particular seasonal trend.
The primary purpose then of a seasonal chart is simply to help a trader spot - almost at a glance - when the most favorable and/or unfavorable periods are for a given tradable within a given calendar year.
The chart below displays the annual seasonal trend for the Japanese Yen.
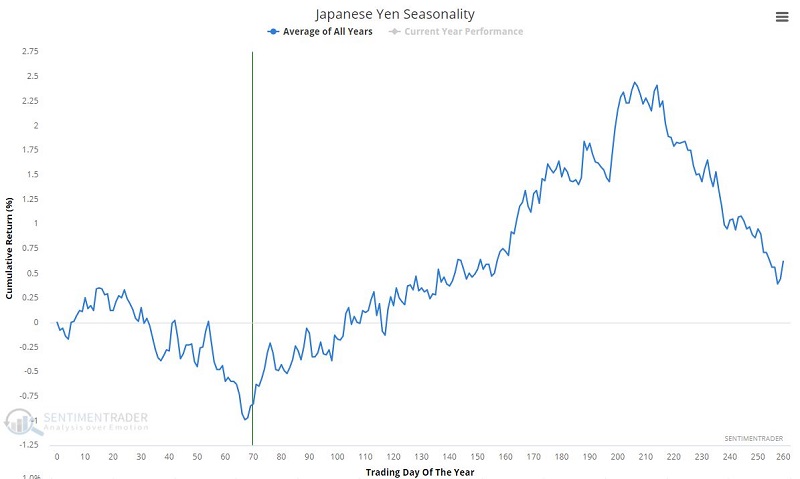
Does anything jump out at you? Anything at all? Well, if your eyes are functioning even moderately well it is pretty clear that the yen tends to experience strength within the early April into late October period. Conversely, the rest of the year tends to experience weakness. So, let's spell it out in as clear (and blunt) of terms as possible.
- This chart DOES NOT tell you that the yen is going to rally every year - or in any particular year for that matter - between April and October
- HOWEVER, this chart DOES tell you that the odds may be in your favor if you are looking for an opportunity to play the long side of the yen during these months
On the other side of the coin:
- This chart DOES NOT tell you that the yen is going to falter every year - or in any particular year for that matter - between November and March
- HOWEVER, this chart does tell you that the odds may be in your favor if you are looking for an opportunity to play the short side of the yen during these months
It should be noted that no one is necessarily encouraged to take a trade solely because of the date on the calendar. The purpose of using seasonality is to try to find an "edge." So, for arguments sake, let's look at:
- Holding a long position is Yen futures (each tick is worth $12.50) from the close on trading day of the year #67 through the close on trading day of the year #206), versus
- Holding a long position is Yen futures (each tick is worth $12.50) from the close on trading day of the year #206 through the close on trading day #67 of the next year)
Note: This is a purely hypothetical test so no slippage or commissions are deducted
In the chart below the blue line represents the long position held during the favorable period (trading days of year 67 through 206) and the orange line represents the long position held during the rest of the year.
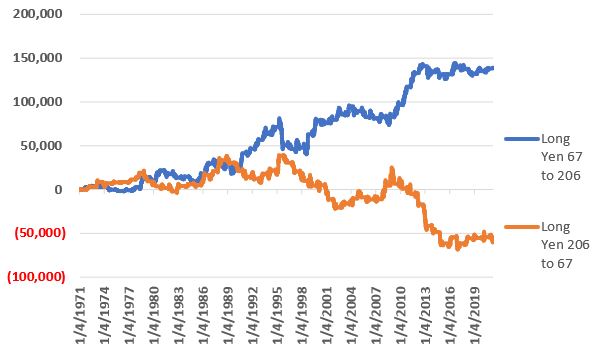
We can see that since the mid 1970's the blue line has generally sloped to the upside and that since the mid 1990's the orange line has generally slopped to the downside. Again, no one is suggesting that you blindly hold a long position during the favorable period and/or a short position during the unfavorable period. A savvier approach would be to look for some other indicators that you typically rely on to confirm a bullish trend during the favorable period and/or to confirm a bearish trend during the unfavorable period.
Example of Combining Seasonality and Trend
The chart below displays the cumulative value of a long position in the yen ONLY when:
- The trading day of the year is greater than 206 or less than or equal to 67 (i.e., the unfavorable period)
- The yen itself is BELOW its own 150-day exponential moving average
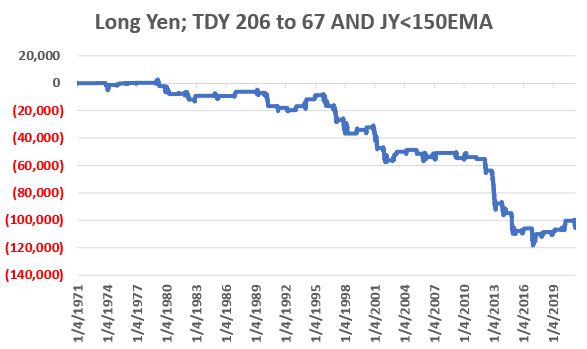
As you can see, not a lot good happens for the yen when this configuration holds. So in theory this configuration might offer an opportunity to play the short side of the yen. This is NOT a suggested trading method, but it does illustrate the potential usefulness of combining seasonal trends with "something else" to confirm the trend suggested by a given seasonal trend.
Recent Changes on the Website
A few subtle - but I believe helpful - changes have been made to the seasonal charts available here on www.Sentimentrader.com. The purpose of these changes is basically to make the most important seasonal trends more readily apparent when looking at a seasonal chart. So, the two key changes are:
- The seasonal chart itself comes up larger on the screen than in the past
- The "Current Year Performance" select is "Off" when the chart comes up
Please note that:
- The current year performance can easily be toggled "On" or "Off" by clicking the "Current Year Performance" label
- The vertical line in the chart represents the current date in relationship to the annual trend
- The horizontal line represents the "0" level
- The "Month of the Year" red and green bars in the lower clip of the seasonal chart page remains unchanged
So how can one use seasonal charts to form trading ideas and opinions. A few examples appear below:
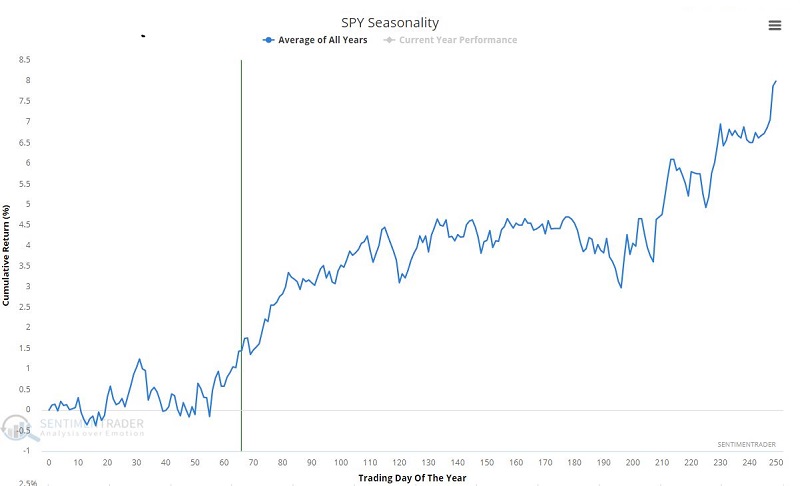
- Glancing at the chart below, is it a good time to get super bearish on stocks? Seasonality suggest "No". Does this mean stocks cannot go down soon? Not at all. But the odds appear to favor the long side of the market for a while longer.
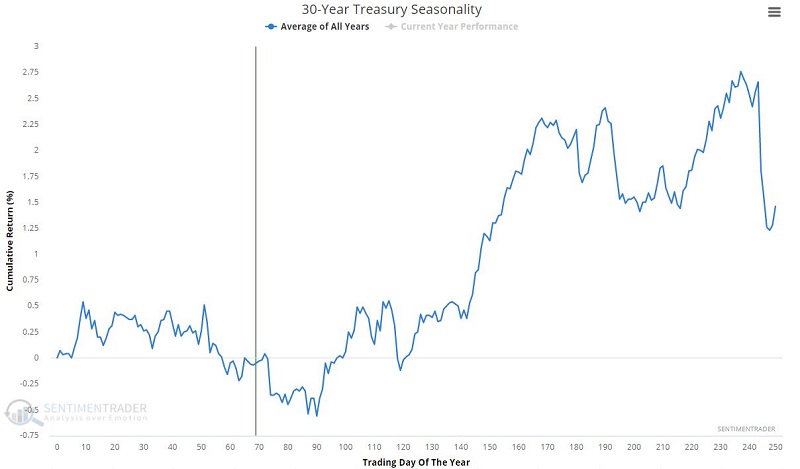
- Is this a good time to get very bullish on t-bonds? Seasonality suggests one be patient just a bit longer for a potentially better buying opportunity and/or better odds of an advance in late spring or early summer.
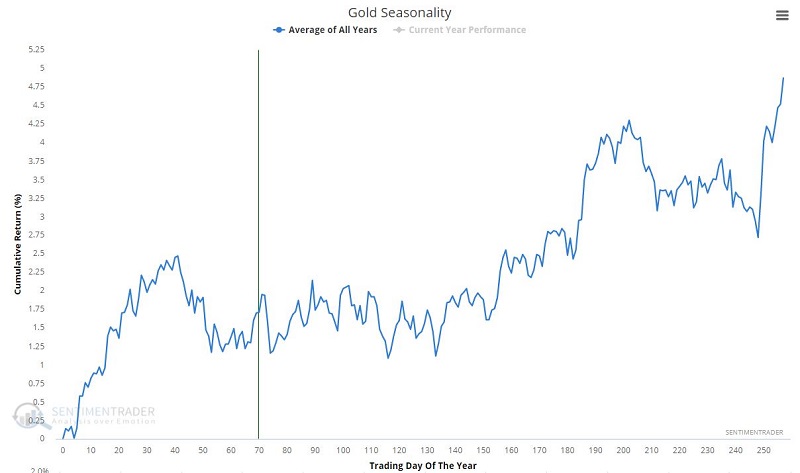
- And what the heck to do with gold? Seasonality suggests nothing at all for a while. If you want to trade gold you'd better find some other tool with which to form an opinion.