
A drop in uptrends under heavy selling pressure

Just a day ago, we saw that there were some dangerous signs underlying stocks' internal participation. Despite major indexes hitting new highs, some shorter-term breadth measures were showing rare and mostly troubling lags.
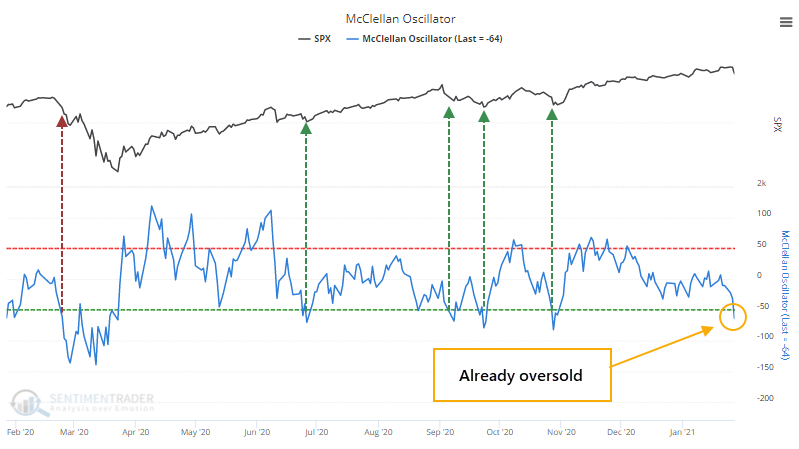
One of those was the McClellan Oscillator, a measure of the momentum among advancing and declining securities. As the S&P 500 was hitting fresh highs, the Oscillator was well below zero, often a warning sign.
When stocks tumbled on Wednesday, the overwhelming number of declining issues pushed the Oscillator further below zero, to the point where it's already suggesting oversold conditions. The last 4 times it got this low, stocks almost immediately rallied. In February, not so much.
Going back to 1928, we can see how markets reacted when the Oscillator fell to a relatively deep oversold reading within only a few days of the S&P 500 being at a 52-week high. See this Knowledge Base article for more detail about what the figures in the table mean.
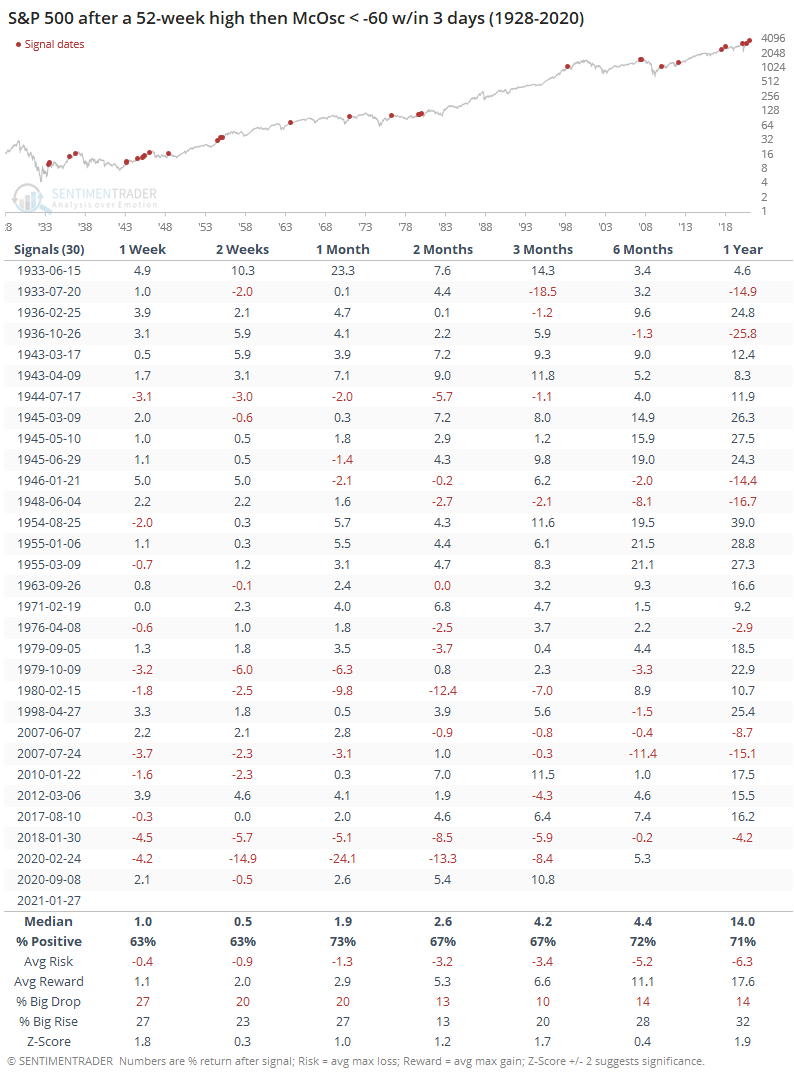
Not much there. Returns going forward were about in line with random.
Something sticks out, though. Markets change over time, and prior to 1962, when these breadth stats became more reliable, forward returns were quite good. Since then, it has been less of a positive factor. Returns up to 6 months later were mostly below random, with high risk relative to reward.
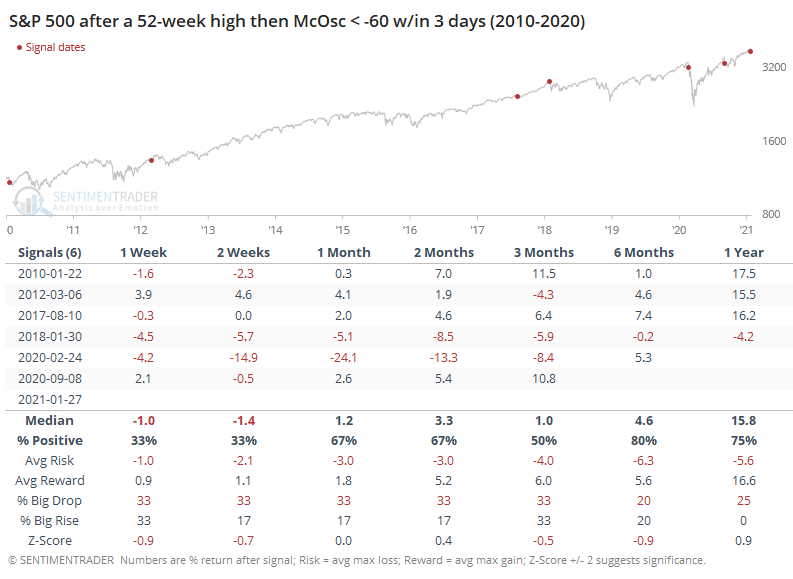
It's been even starker in the past decade. Despite a persistent bull market, stocks showed a tendency to see further losses over the next couple of weeks. One time it didn't, in 2012, it quickly gave back its gains. The other, in 2017 preceded a low-volatility creeper uptrend, so that was an exception.
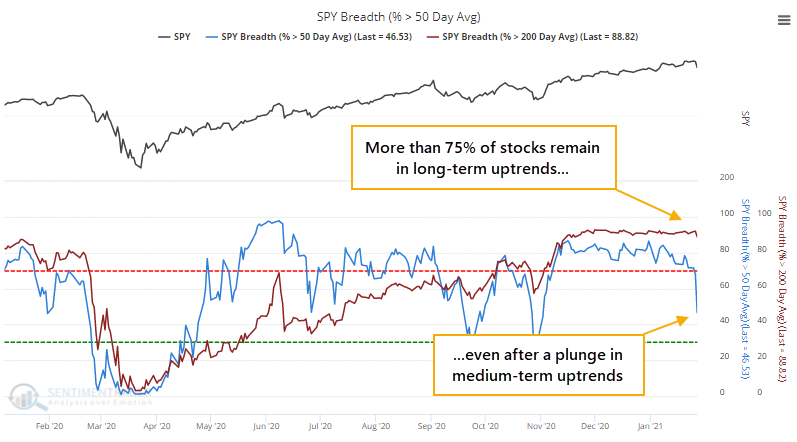
 There was also a dramatic drop in the percentage of members in the S&P 500 holding above their 50-day moving averages. It plunged more than 20% on Wednesday alone, one of the largest single-day drops in medium-term trends in years. Even so, well over 75% of stocks are still holding long-term uptrends, trading above their 200-day moving averages.
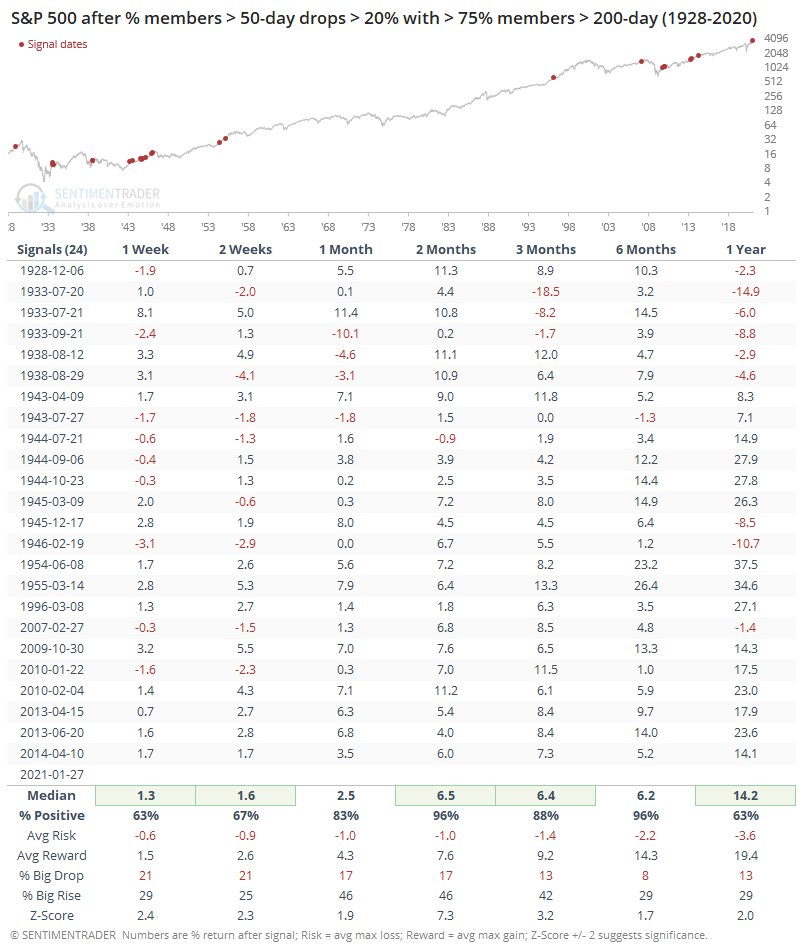
A swift correction in medium-term trends within the context of long-term uptrends has usually resolved to the upside, especially over the next 3-6 months. Three months later, there was only a single small loss, and the risk/reward was excellent.
We've seen a ramp in speculative activity, but it had been offset by a pristine market environment, with broad participation and impressive buying thrusts. That started to crack over the past 1-2 weeks, and now we've seen an intense bout of selling pressure amid what can clearly be classified as isolated pockets of bubble-type activity.
The heavy selling on Wednesday triggered some conflicting data sets, with some suggesting oversold conditions that tend to resolve higher, and others suggesting it's just the beginning salvo. In a general sense, and this is more experience than evidence talking, is that when we see activity like this, it can lead to a shorter-term rebound, perhaps even back to the recent highs. That's when we very often see more warning signs trigger, with stark divergences underlying the indexes. I suspect that if we do see a rebound in the coming week(s), more and more risk-off signals are going to start firing.