A Dollar Trend to Watch
When it comes to the U.S. dollar, too often, the "cycle" goes something like this:
Step #1. In the financial news, the conflicting stories typically fall into one of two categories:
- Those that argue that inflation and debt mean the dollar is doomed to decline
- Those that argue that the Fed will ultimately have to raise interest rates and that higher rates will make the U.S. dollar more attractive relative to other currencies, thus the dollar is destined to rise
Step #2. The average investor weighs these two conflicting theories and decides which they feel is the better argument.
For better or worse, I prefer to look at things I can quantify.
The chart below (courtesy of ProfitSource) displays the U.S. Dollar Index along with its 52-week exponential moving average.
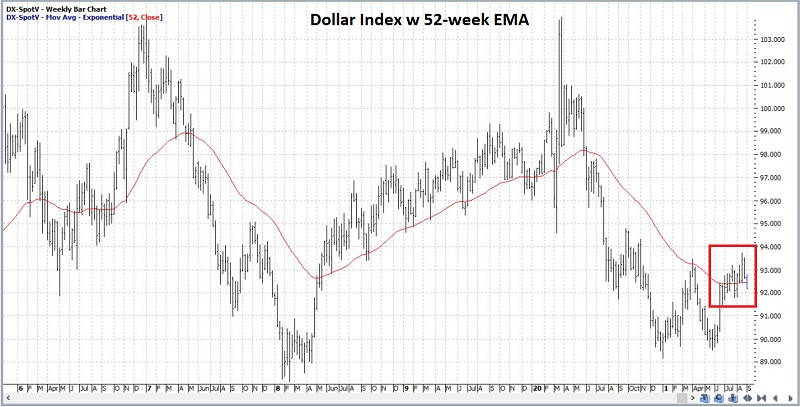
In general, if the U.S. dollar is above its 52-week EMA and above support/resistance near 88.80, this is favorable for the dollar.
The dollar has tended to move in four-year swings. Once again, we are not talking about picking tops and bottoms with uncanny accuracy. We are merely trying to gain an edge by paying attention to long-term cycles.
With those caveats in mind, the chart below displays the cumulative % price performance for the U.S. dollar ONLY during those times since 1969 when the dollar was below its 52-week EMA and it was within the 4-year "unfavorable" portion of the 8-year cycle.
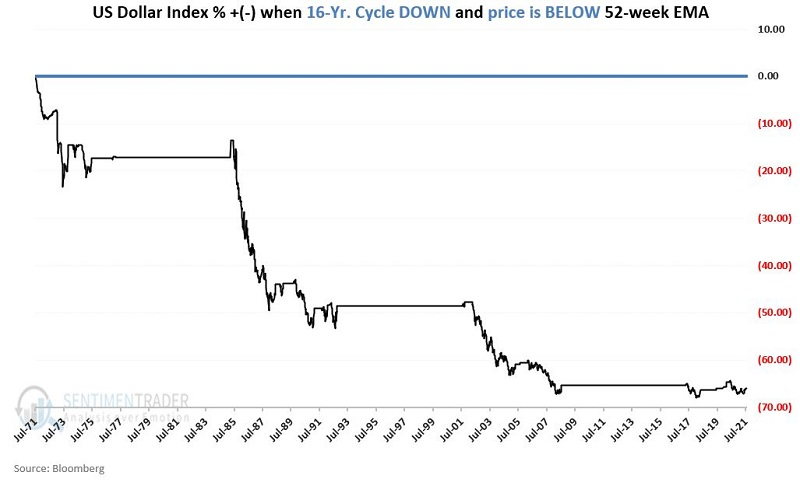
It is always possible that the cycle will prove the exception to the rule and that the U.S. dollar may advance significantly. The important thing to note is that it will have to swim upstream of these historical trends to do so.
What else we're looking at
- More details on the dollar's trend, cycles, and upcoming seasonal window
- An update on absolute and relative trends in industry, sector, and country ETFs
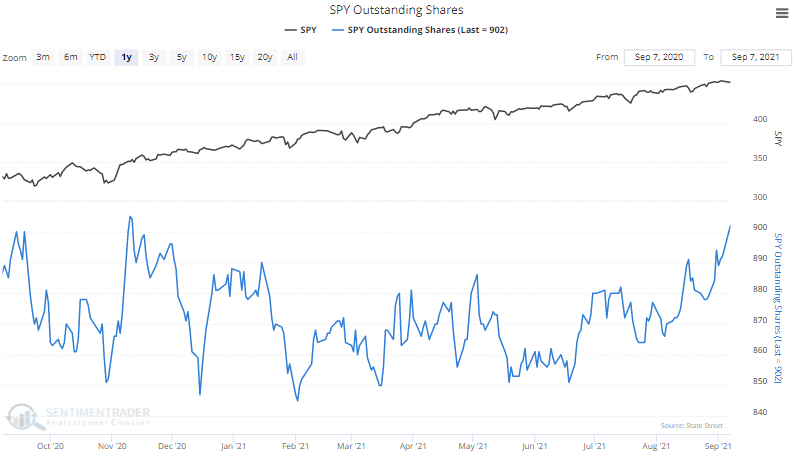
| Stat box The SPY fund, tracking the S&P 500, enjoyed an inflow of more than $4.6 billion on Tuesday. That's the 7th-largest single-day inflow to the fund in the past 3 years. |
Etcetera
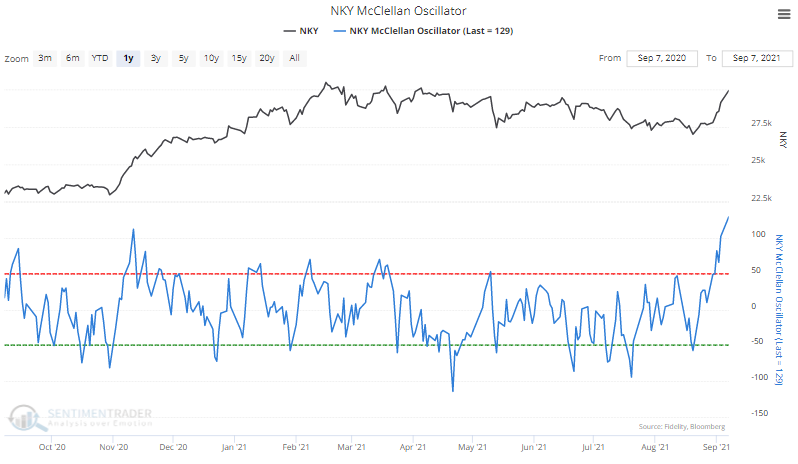
A yen for Japanese shares. Investors have rushed into stocks listed in Japan, pushing the McClellan Oscillator - a measure of breadth momentum - to one of its highest levels in 20 years.
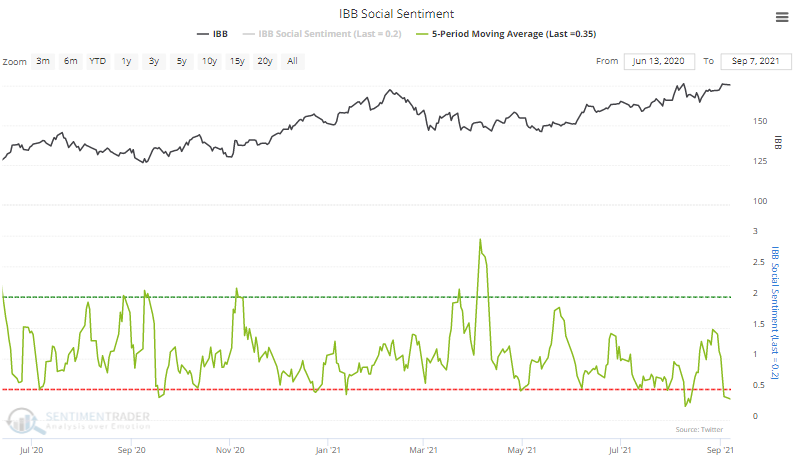
Bullish on bios. The Social Sentiment score for the IBB Biotech fund has neared a record low over the past 5 sessions. This is calculated like a put/call ratio, so the lower the score, the more bullish messages have been posted on social media.
Scooping up SPY. Shares outstanding in the most important ETF in the world, tracking the S&P 500 index, have soared in recent weeks. While some of that could be creations to meet the demand of short-sellers, when it occurs with a rising market, it's more likely that buyers are eager.
