
A dead-cat bounce (?) amid near-record volatility

Dead-cat bounce
In a report over the weekend, we saw just how lopsided the selling pressure was last week. Most of the days suffered wholesale selling pressure on a scale that has rarely been seen.
So far this week, we’ve already had two massive rally days in relief. There’s always something to complain about, and one of the potential problems is that breadth hasn’t been overwhelming. While there was a clear “get me out” mentality last week, the huge up days so far this week haven’t quite been “get me in.”
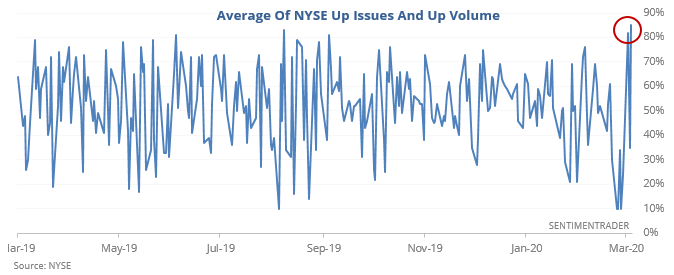
This raises the specter that we’re just seeing a dead-cat bounce powered by short-covering - buzz words that don’t really mean anything. And we see that when stocks rally hard on below-average breadth, it hasn't been the terrible sign it's made out to be. Long-term, though, returns were better when we saw true 90% up days.
Daily swings
The U.S. stock market continues to experience large daily swings. A 7 day average of the S&P 500's daily high/low range is at the highest level since the August 2011 stock market crash:
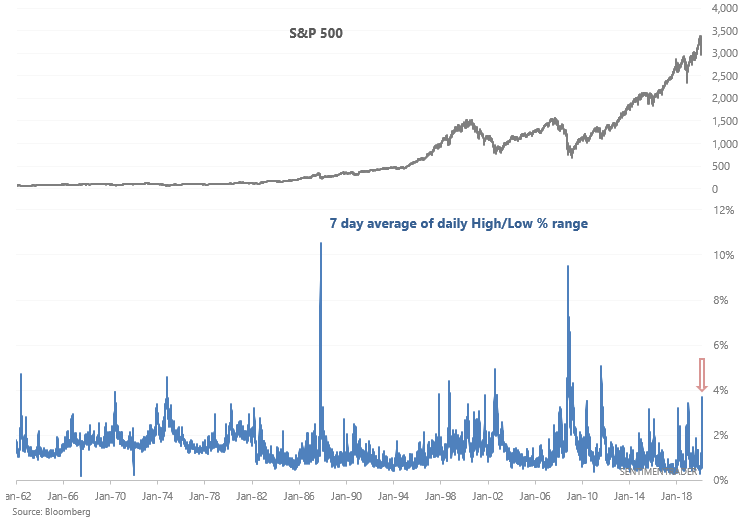
Extreme volatility isn't consistently bullish or bearish in the short term. The market can swing both ways (more often than not, the market crashes, bounces, and then pulls back before bottoming). But since extreme volatility tends to happen after a stock market crash, this was mostly bullish for stocks over the next 3-12 months.
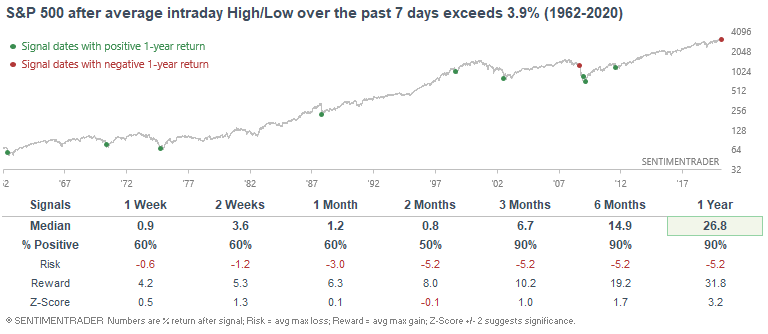
Some cases saw the S&P bottom immediately, while others saw large losses followed by a rally. In times like this, it's usually better to focus on medium term risk:reward than to be driven insane by the market's large intraday movements.
This is an abridged version of our recent reports and notes. For immediate access with no obligation, sign up for a 30-day free trial now.
We also looked at:
- The Cumulative Advance/Decline Line made a new high in February and we far exceeded the average drawdown
- Fewer than 40% of stocks in the S&P 500 had been holding above their 200-day averages
- More than 20% of newsletter writers expected a decline, ending the 2nd-longest streak since 1969
- Bond optimism is nearing record levels
- What happens when every S&P 500 sector moves in the same direction
- There has been a huge 3-week move in high-yield bond spreads
- The 2-year Treasury yield is historically oversold - what that means for stocks