Data &
Technology
Research
Reports
Report Solutions
Reports Library
Actionable
Strategies
Free
Resources
Simple Backtest Calculator
Simple Seasonality Calculator
The Kelly Criterion Calculator
Sentiment Geo Map
Public Research Reports
Free Webinar
Pricing
Company
About
Meet Our Team
In the News
Testimonials
Client Success Stories
Contact
Log inLoginSign up
< BACK TO ALL REPORTS

A couple of days with overwhelming selling

Jason Goepfert
2020-11-02
Last week, 2 out of 3 days showed historically low Up Volume and Up Issues, rare to see during mostly healthy markets.

On Monday and Wednesday last week, selling pressure was overwhelming enough that most securities fell, and most of the volume on the NYSE was focused on those issues.

The 3-day average of NYSE Up Issues and Up Volume both dropped to below 20%. That shows wholesale, get-me-out selling pressure. Often, we'll see a lot of down issues, but maybe not a lot of volume. Or maybe there will be a lot of volume flowing into relatively few declining stocks.

Earlier this week, it was both. The 3-day average of NYSE Up Issues dropped to within the lowest 0.2% of all readings since 1962.

NYSE up volume ratio

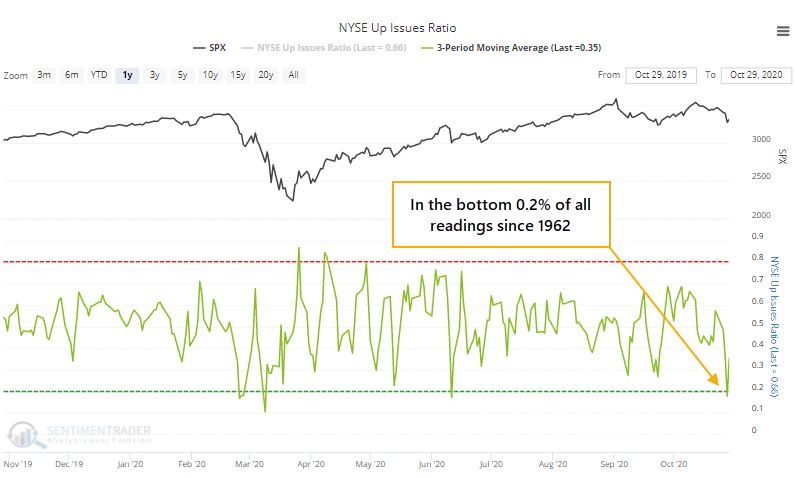
It's not all that unusual to see extremely depressed breadth over a multi-day period during a bear market. It's rarer to see it when stocks have been holding up fairly well.

Overall, this kind of behavior has typically led to some shorter-term give-back of whatever gains helped to push the Up Issue and Up Volume Ratios above 20%. But over the next 1-3 months, there was a strong tendency to see gains following the selling pressure that was extreme enough to push them both below 20% in the first place.


What else is happening

These are topics we explored in our most recent research. For immediate access with no obligation, sign up for a 30-day free trial now.

  • What happens when short-term breadth recovers during various market environments
  • ETF traders have pulled out of dividend funds, and piled into momentum

Stat Box

The S&P 500 ended up with a loss of more than 1% in October, after setting a multi-year closing high at some point in the past few months. When this happened during any year since 1928, the S&P rose over the next 3 months 10 out of 12 times, with both of the losses being smaller than -3.5%.

Sentiment from other perspectives

We don't necessarily agree with everything posted here - some of our work might directly contradict it - but it's often worth knowing what others are watching.

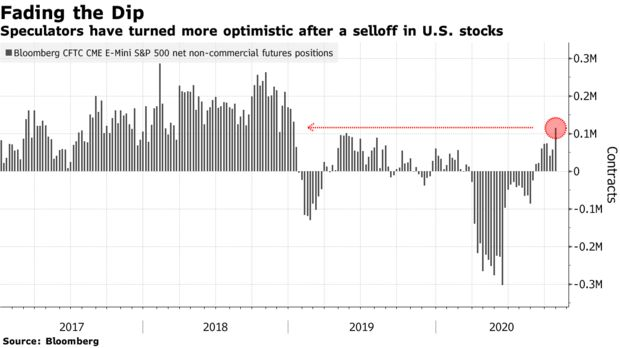
1. Speculators in S&P 500 futures contracts pushed their net long position to the highest in almost 2 years - Bloomberg

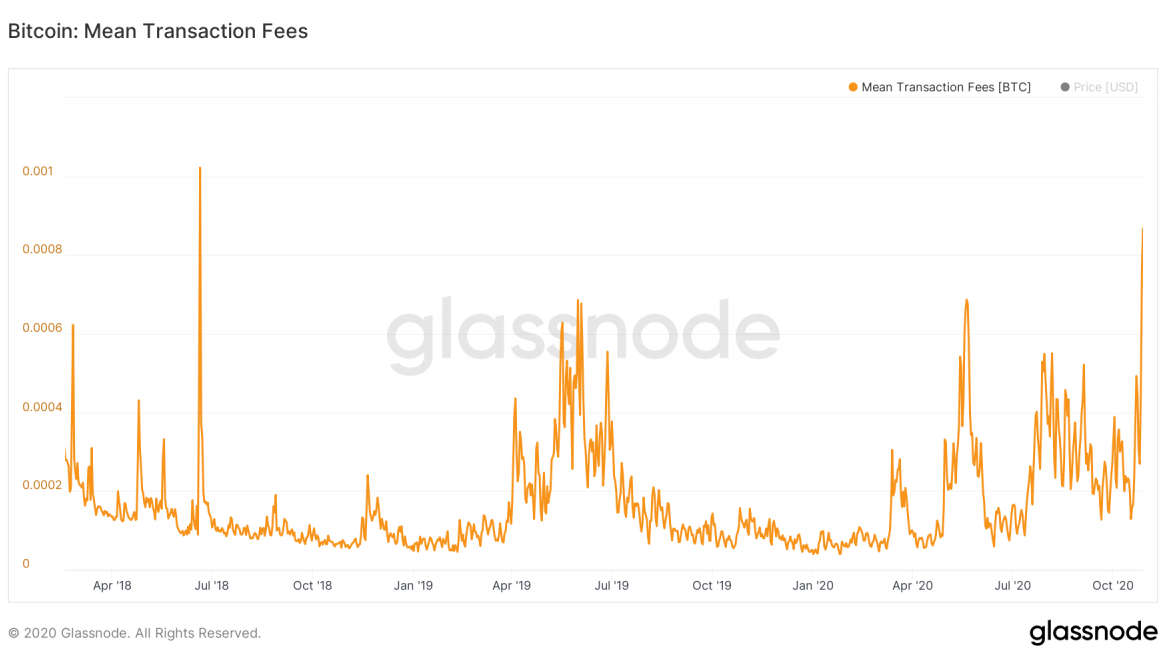
2. The cost of a bitcoin transaction has surged, which usually happens when demand is high (and prices struggle after) - Coindesk

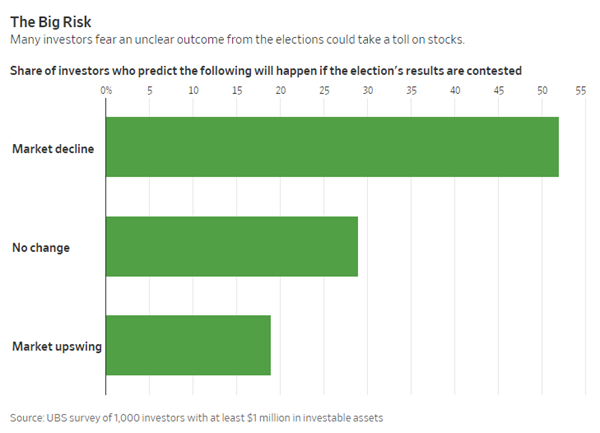
3. Rich people think stocks will drop if we don't have a clear winner on election night - Wall Street Journal

DATA &
TECHnologies
IndicatorEdge
‍
BackTestEdge
‍
Other Tools
‍
DataEdge API
RESEARCH
reports
Research Solution
‍
Reports Library
‍
actionable
Strategies
Trading Strategies
‍
Smart Stock Scanner
‍
FREE
RESOUrCES
Simple Backtest
Calculator
Simple Seasonality
Calculator
The Kelly Criterion
Calculator
Sentiment Geo Map
‍
Public Research Reports
‍
Free Webinar
COMPANY
‍
About
‍
Meet our Team
‍
In the News
‍
Testimonials
‍
Client Success Stories
Pricing
Bundle pricing
‍
Announcements
‍
FAQ
© 2024 Sundial Capital Research Inc. All rights reserved.
Setsail Marketing
TermsPrivacyAffiliate Program
Risk Disclosure: Futures and forex trading contains substantial risk and is not for every investor. An investor could potentially lose all or more than the initial investment. Risk capital is money that can be lost without jeopardizing ones’ financial security or life style. Only risk capital should be used for trading and only those with sufficient risk capital should consider trading. Past performance is not necessarily indicative of future results.

Hypothetical Performance Disclosure: Hypothetical performance results have many inherent limitations, some of which are described below. No representation is being made that any account will or is likely to achieve profits or losses similar to those shown; in fact, there are frequently sharp differences between hypothetical performance results and the actual results subsequently achieved by any particular trading program. One of the limitations of hypothetical performance results is that they are generally prepared with the benefit of hindsight. In addition, hypothetical trading does not involve financial risk, and no hypothetical trading record can completely account for the impact of financial risk of actual trading. for example, the ability to withstand losses or to adhere to a particular trading program in spite of trading losses are material points which can also adversely affect actual trading results. There are numerous other factors related to the markets in general or to the implementation of any specific trading program which cannot be fully accounted for in the preparation of hypothetical performance results and all which can adversely affect trading results.

Testimonial Disclosure: Testimonials appearing on this website may not be representative of other clients or customers and is not a guarantee of future performance or success.