
A Countertrend Example using Ticker SPY

Following a theme from this piece, this article will delve into countertrend trading ticker SPY (SPDR S&P 500 ETF Trust ). So, let's invokes the caveats right up front:
- This piece is intended to be educational in nature
- It will highlight alternative strategies and compare the pros and cons of each
- ALL trades in this piece are to be considered as hypothetical examples
- NO trades in this piece should be considered "recommendations"
- The purpose of this piece is NOT to suggest that SPY is about to decline
OK, that should do it. Now let's move on to the "theory" behind the example trades below.
THE THEORY
For the sake of illustration, we will assume that Trader A and Trader B have analyzed ticker SPY and have made the following assumptions/determinations (which - as you may have noticed if you have been in the trading game for more than a day or two - don't always pan out):
- The stock market is due for a pullback
- NOT playing for a Crash (although Trader A thinks it is possible)
- Looking for SPY to work lower, possibly as low as 422 (previous support/resistance)
- Expect decline anytime between now and mid-October
- Not willing to risk a lot of $
- Don't want to sell short futures contracts
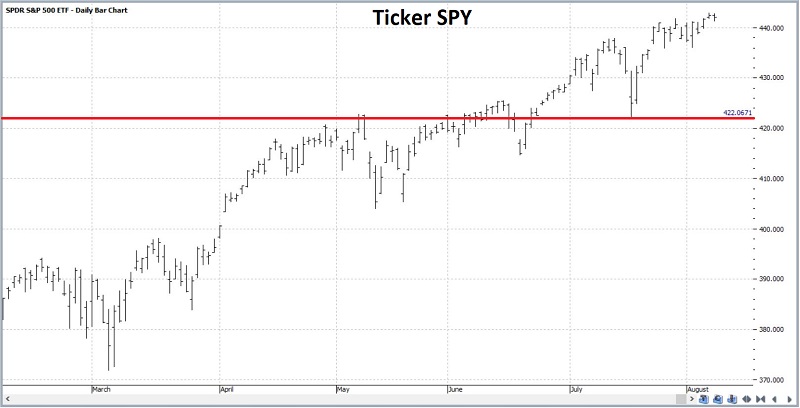
The daily chart below (courtesy of Profitsource) displays ticker SPY with the 422 level highlighted. In this chart, 422 looks like a pretty substantial move.
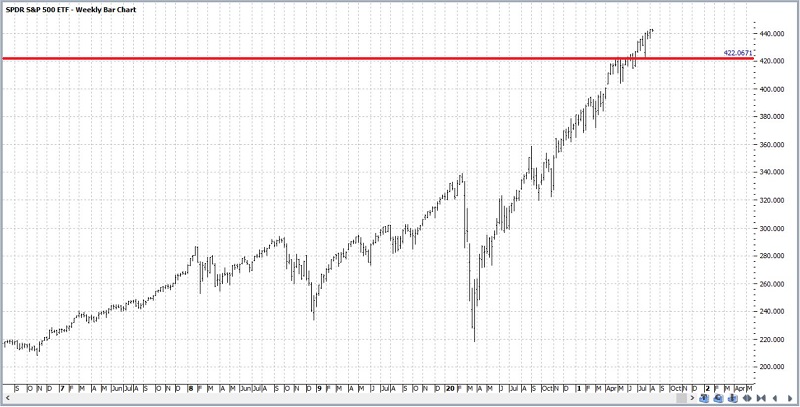
The weekly chart below also displays ticker SPY with the 422 level highlighted. In this chart, a move down to 422 looks more like a minor blip.
In any event, the primary concern for a countertrend trader is that SPY will simply breakout to a new high and head off to the races once again, just as it has for most of the last year. This makes selling short SPY or selling short eMini S&P 500 futures particularly perilous. So for a trader who still wants to take a shot at the short side, let's look at two alternate, limited risk ways to play.
TRADER A: BUYS A PUT OPTION ON TICKER SPY
The most straightforward approach would be to buy a put option. For the sake of example, Trader A will:
- Buy the SPY Oct15 442 put @ $11.20
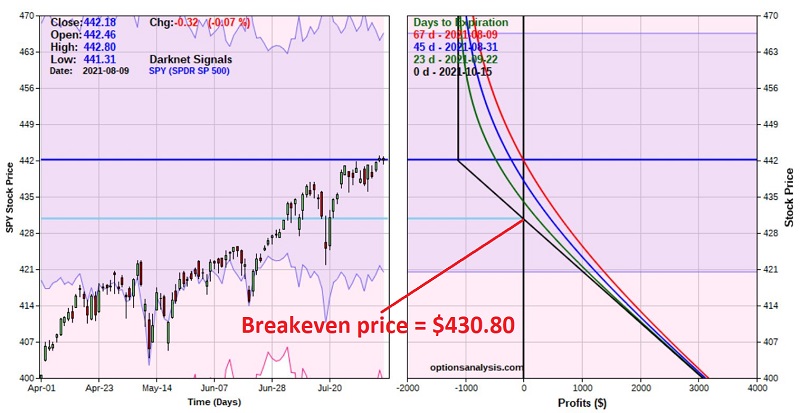
The particulars for this trade appear in the screenshot below and the risk curves in the chart below that (all charts below are courtesy of Optionsanalysis.com).
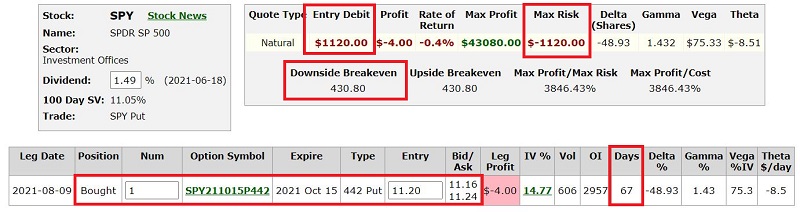
Things to note:
- The cost to enter the trade - and the maximum risk - is $1,120 (which would be realized if the option was held until expiration AND SPY was above $442 a share at that time)
- This trade has unlimited profit potential (so if the market were to crash, there is no limit to what Trader A might make)
- The breakeven price at expiration is $430.80 a share for SPY (i.e., SPY shares MUST experience a meaningful decline for this trade to profit)
- Time decay works against this trade (note how the colored lines in the chart above gravitate towards lower profits/greater losses over time - this is due to time decay; i.e., the option losing its time premium as option expiration draws closer)
- If SPY DOES hit $422 a share during the life of this trade, the expected profit will be roughly $1,250 to $850, depending on whether $422 is hit sooner or later.
- If SPY were to rally 15 points to $457.18 during the life of this trade, the expected loss would be roughly -$590 to -$1,120, depending on whether $457 is hit sooner or later
In a nutshell, this trade is an aggressive bet on a meaningful decline in SPY:
- IF SPY declines enough, profit can be substantial
- BUT the breakeven price at expiration is $430.80
- AND if SPY breaks out to new highs instead, a significant percentage loss will accrue very quickly
TRADER B: BUYS A DIAGONAL PUT CALENDAR SPREAD
It sounds complicated. But really, all that is involved is Trader B doing the following:
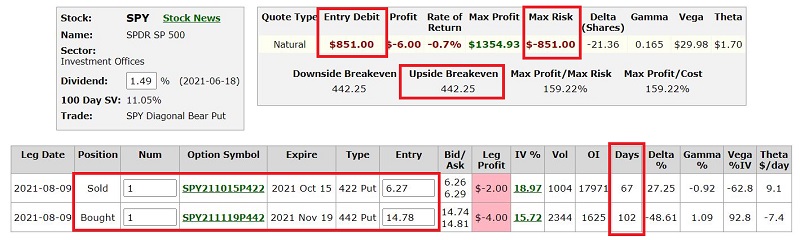
- Buy the SPY Nov15 442 put @ $14.78
- Sell the SPY Oct15 422 put @ $6.27
The particulars for this trade appear in the screenshot below and the risk curves in the chart below that.
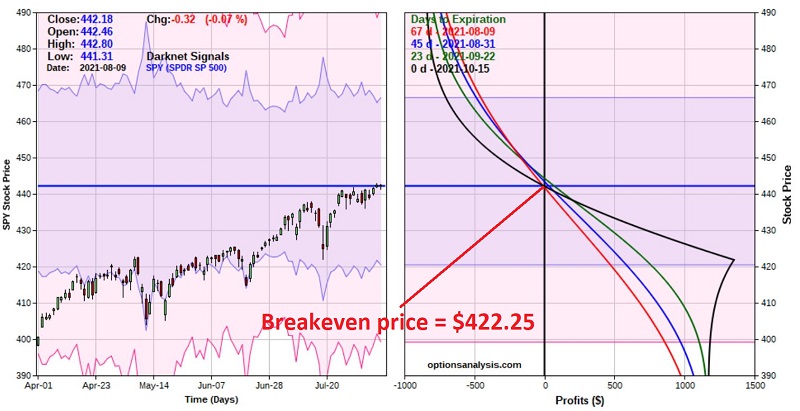
(Note that the black line in the chart above represents the expected P/L as of October option expiration. If this position were held until that time, the October option would expire (or be exercised), and Trader B would still be holding the November 442 put.)
A glance at the risk curves above reveals a similar - yet very different - position than the long-put position above.
Things to note:
- The cost to enter the trade - and the maximum risk - is $851 (As you can see by looking at the black line in the risk curve chart above, SPY would have to rally somewhere north of $480 a share by October expiration to experience a loss of this magnitude)
- This trade has limited profit potential (In theory, the maximum gain would occur if SPY were to close at exactly $422 a share at October option expiration. So, if the market were to crash, there is a limit to what Trader B might make)
- The breakeven price at expiration is $442.25 a share for SPY (i.e., a decline in the share price of SPY of ANY SIZE can generate a profit - in contrast to the long-put position, which MUST see a meaningful decline in SPY to profit)
- Time decay can work for OR against this trade, depending on whether SPY declines or rises in price (if SPY rises in price, time decay will start to work against this trade. However, if SPY declines, the open profit on this position can grow as time goes by, based solely on time decay)
- If SPY DOES hit $422 a share during the life of this trade, the expected profit will be roughly $433 to $1,385, depending on whether $422 is hit sooner or later.
- If SPY were to rally 15 points to $457.18 during the life of this trade, the expected loss would be roughly -$300 to -$550, depending on whether $457 is hit sooner or later
In a nutshell, this trade is a bet that SPY will decline below its current price SOMETIME between now and October option expiration.
COMPARING THE EXPECTATIONS
The trades above are similar yet very different. The best way to illustrate is to compare expected profit or loss at different price levels for SPY. The table below displays the expected $ profit or loss for each trade based on the price of SPY shares as of the October options expiration date of 10/15/2021.
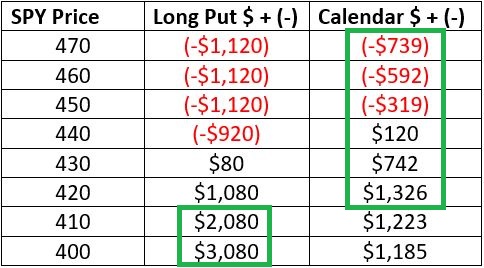
Note that:
- At any price ABOVE roughly $418 per SPY share, the diagonal calendar spread will OUTPERFORM the Long Put
- At any price BELOW roughly $418 per SPY share, the diagonal calendar spread will UNDERPERFORM the Long Put
In a nutshell:
- Trader A is betting on a quick decline OR a drop in SPY below $418 a share
- Trader B is betting on SOME price decline below $442 a share for SPY
SUMMARY
Let's face it, betting against the stock market has been a terrible idea for most of the last year. And there is every possibility that a breakout to new highs and another runup is in the cards. The trades detailed above are not "recommended" trades, but rather examples of two different approaches to:
- Expressing a countertrend opinion
- While taking on a limited, defined amount of risk
The most important things from this piece are not the example trades themselves but rather the underlying principles of:
- Spotting a potential opportunity (i.e., in this case, a decline within the seasonally weak period ahead)
- Exploiting that opportunity (using a limited risk approach)
These particular example trades may or may not work out. But the underlying principles will endure.