
A Contrarian Play in Bonds

Long-term treasuries have taken it on the chin since topping in March 2020. It was not until recently that they showed any signs of life. And even then, given all the concerns - real and/or imagined - regarding inflation and Fed activity, a great deal of doubt continues to surround the long-term treasury.
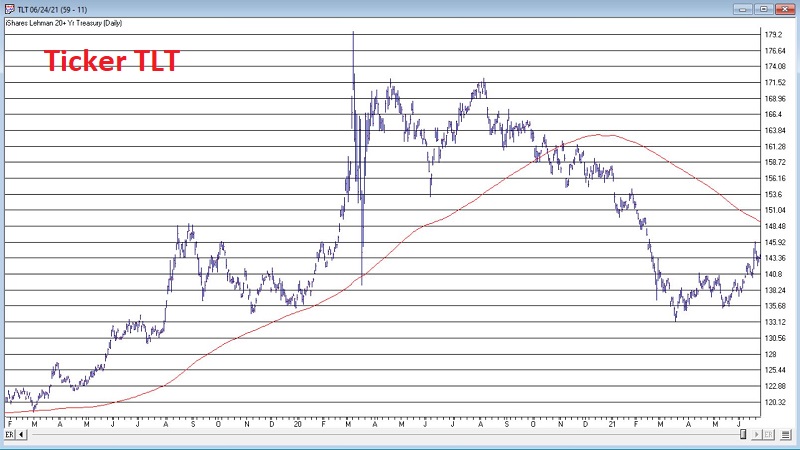
The level of concern is valid, particularly given that ticker, TLT (iShares 20+ Year Treasury Bond ETF) remains well below its declining 200-day moving average, as seen in the chart below (courtesy of AIQ TradingExpert).
THE REALLY BIG PICTURE
To me, the most important bond chart remains the one shown below (also courtesy of AIQ TradingExpert), which displays ticker TYX (the yield on 30-year treasuries x 10) along with its 120-month exponential moving average.
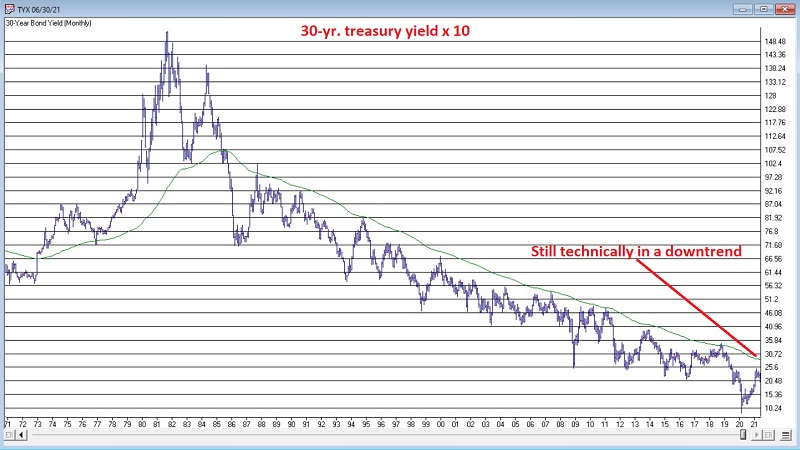
Interpretation is fairly simple:
- TYX < 120-month EMA = Long-term interest rate downtrend
- TYX > 120-month EMA = Long-term interest rate uptrend
When the day comes that TYX moves decisively about this long-term moving average, virtually everything that investors (think they) have learned about bonds in the past 35+ years will change dramatically. Until then, the long-term trend in interest rates remains "down" - i.e., bullish for bonds.
Now, of course, this simple analysis tool will never pick the bottom in interest rates - and in fact, the bottom may be already in. But for now, the "trend" in interest rates is still designated as "down" according to this rudimentary (also highly effective at keeping investors on the right side of the bond market for at least 5 decades) form of analysis.
SEASONALITY
The chart below displays the Annual Seasonal Trend for ticker TLT. Note that we are entering what has typically been a very favorable time of year for long-term treasuries.
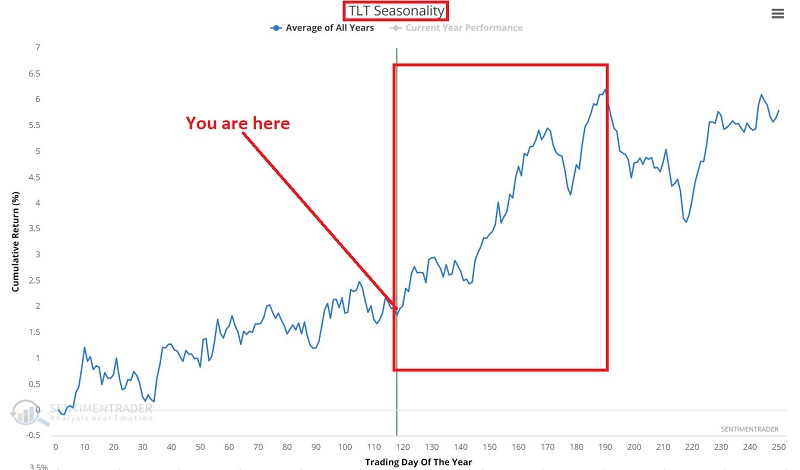
As always, seasonality does NOT tell you what will happen, only what has tended to happen in the past. Nevertheless, the main point is that IF long treasuries are going to rally, the months directly ahead would be as likely a time as any for this to occur.
CURRENT SENTIMENT (AND THE REALLY COUNTERINTUITIVE PART)
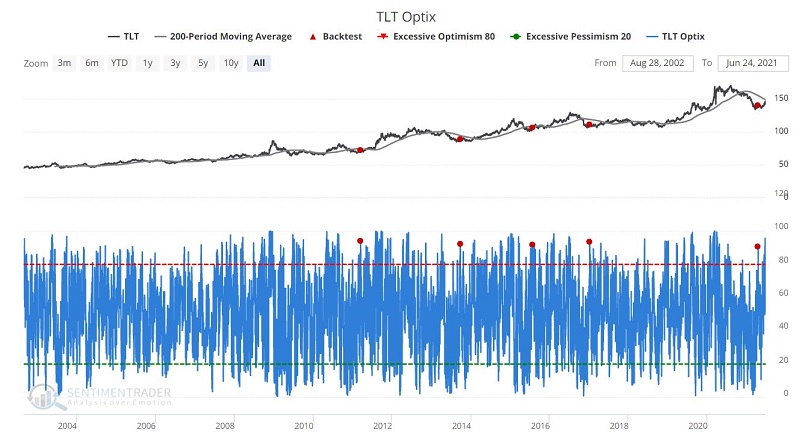
High bullish sentiment readings are typically an unfavorable sign for the security under analysis. Generally, a high Optix reading suggests "too many bulls," who have likely already bought, and thus a lack of potential new buyers who can come in and drive a given security higher.
Still, every once in a while, a burst of optimism can change the trajectory for a given security. In the test below, we look for those times when:
- TLT is below its 200-day moving average
- TLT OPTIX tops 90% for the first time in 126 days
By clicking this link then clicking "Run Backtest," you can replicate the test below.
The chart below displays the small handful of signals that have occurred.
On the one hand, it must be noted that this is a very small sample size from which to draw any definite conclusion. That said, the results are compelling. In the short term, TLT performance following previous signals was below average. However, in the 6 to 12 months after a signal, TLT has responded quite favorably. The results appear in the table below.
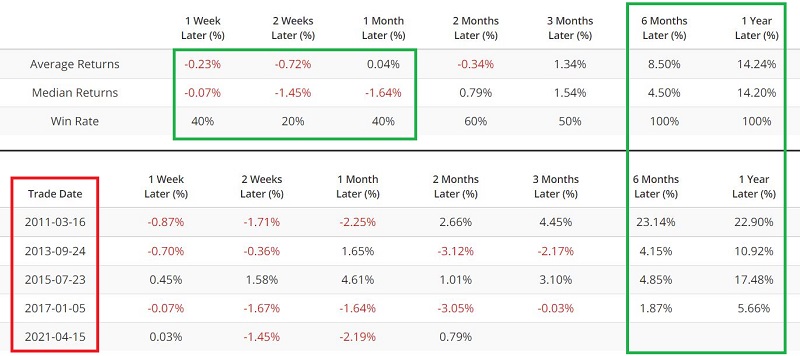
A new signal occurred on 4/15/21. Since that time, TLT has rallied slightly.
TRADITIONAL PLAYS
The most straightforward play for a trader wishing to play the long side of long-term treasuries would be to:
- Take a long position in T-Bond futures
- Buy shares of ticker TLT
Both of these positions entail a significant amount of financial commitment and/or dollar risk. To enter a t-bonds futures position, a trader must put up $4,320 in margin. This is NOT, however, one's maximum risk.
- Each one full point in price movement for t-bonds futures represents $1,000
- If t-bond futures are trading at $160, this means that the value of the contract is $160,000
- So, the $4,320 margin requirement represents just 2.7% of the full contract value
- To put it another way, a t-bond futures trader assumes leverage of roughly 37.8-to-1
Again, a great way to maximize profit potential - but also with a degree of leverage that many individuals are not prepared to deal with.
If the ETF ticker TLT is trading at $142.01 a share, then:
- A trader must put up $14,201 to buy 100 shares
- There is no leverage involved here, so a 3% movement up or down in the price of TLT would result in a gain or loss of 3% (unless a trader chose to buy shares in a stock margin account, in which case they would put up $7,100 and would borrow the rest from their broker).
AN OPTIONS PLAY
What follows is not a "recommendation," but rather an example of one way to play the situation discussed earlier (i.e., a contrarian bullish position in long-term treasuries) WITHOUT assuming the dollar commitment and/or risks associated with the positions highlighted above. Our objective is to:
- Make money if long-term treasuries do, in fact, advance in price
- Give the trade some time to work out
- Minimize our dollar commitment and risk versus simply buying shares of TLT
One example of a way to do this would be to:
- Buy 2 TLT Jan2022 150 calls @ $3.35
- Sell 2 TLT Dec2021 160 calls @ $1.26
This strategy is typically referred to as a "diagonal out-of-the-money calendar spread." The basic objective is:
- For the longer-term in the money option to gain value as the price of the underlying security rises
- To sell a shorter-term further out-of-the-money call to help finance the purchase of the long call
The figure below displays the particulars of this trade (all charts and figures below are courtesy of www.Optionsanalysis.com)
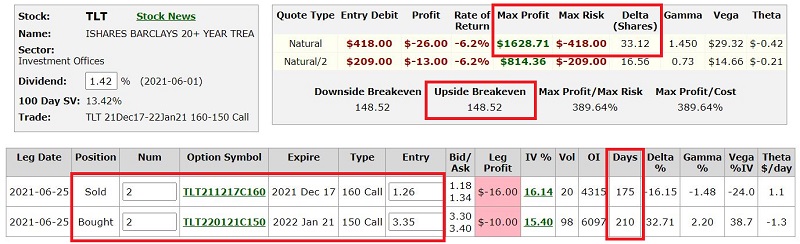
The key things to note:
- Cost to enter and maximum risk = -$418 (only 2.9% as much as the $14,201 needed to buy 100 shares of TLT)
- Maximum profit potential = $1,629
- Breakeven price at expiration = $148.52
The chart below displays the risk curves - i.e., the expected P/L for the position as of:
- A given price for TLT
- A given date (red line is immediate, blue line as of 8/22, green line as of 10/19, and black line as of December expiration)
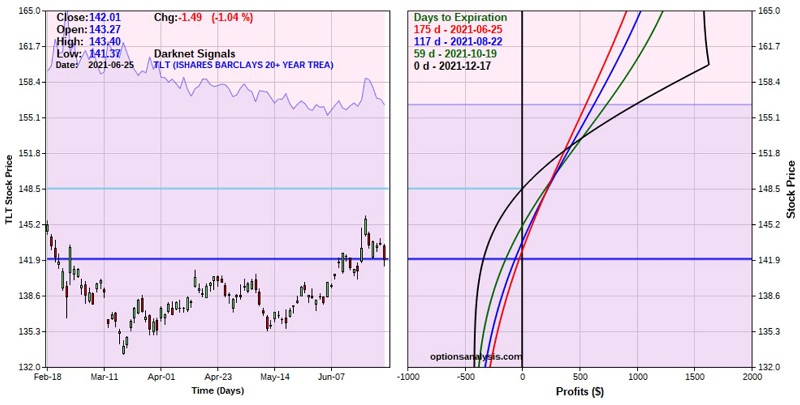
The key things to note:
- The December options have 175 days left until expiration, so there are roughly 6 months for TLT to move higher
- TLT MUST move higher for this trade to accrue any meaningful profit
- If TLT declines, the worst case is a loss of -$418
Regarding managing this position:
- If TLT shares exceed $160 a share during the life of the trade, it is possible for the short December calls to be exercised against. As a result, a trader should likely consider taking a profit or adjusting the position in some way of TLT approaches $160 a share
- A break below $133.19 for TLT shares would represent a failure of support. A trader should decide in advance if they will cut their loss at that point or if they will let the position ride secure in the knowledge that a loss of -$418 is their worst-case scenario.
SUMMARY
So, will TLT surprise a lot of people and rally in the months ahead? And if it does, is an option trade the best way to go? Those are the questions that a trader must ask and answer before considering the example trade we just discussed.
But at least now you know that there is a possibility that bonds might surprise everyone despite all of the current concerns weighing on the bond market. And you also know that there are less capital-intensive possibilities in terms of "ways to play" versus trading futures or making a large dollar commitment to buy ETF shares.