A composite trend model signal confirms a new uptrend
Key points:
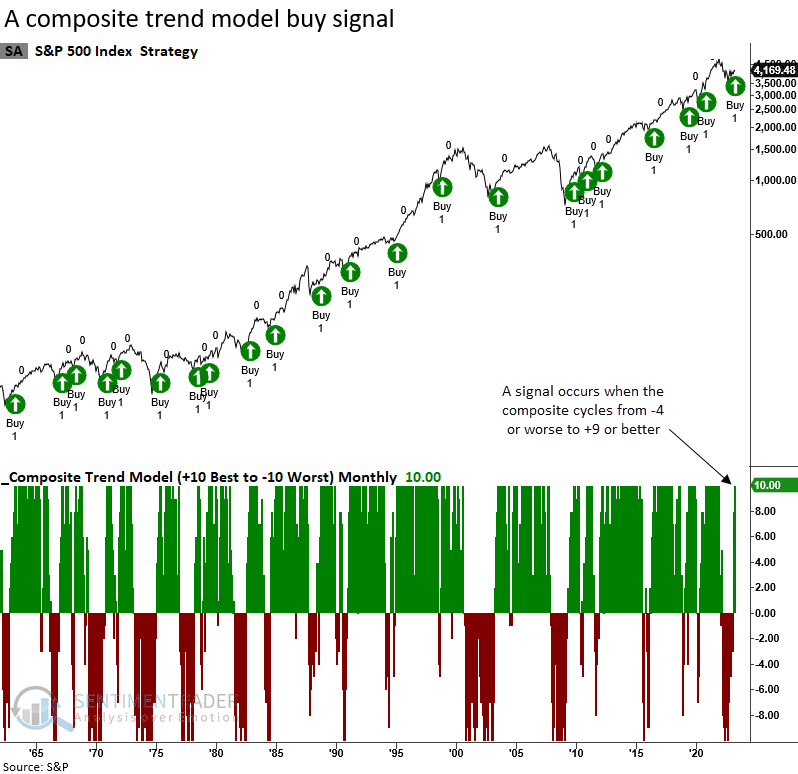
- A composite that contains ten trend-following indicators cycled from -4 to +9
- Similar reversals over the past 100 years preceded outstanding returns for the S&P 500
- The TCTM Composite Confirmation Model score increased to 30% with the new trend change signal
The big picture suggests a transition from a downtrend to an uptrend
In a recent note, I shared a composite trend model buy signal for the S&P 500. The model utilizes weekly data and is a member of a more comprehensive composite, the Composite Master New Bull Market Model.
With April coming to a close, a composite trend model that uses monthly data for the S&P 500 increased to a bullish score of +10, triggering a trend change buy signal for a member of the TCTM Composite Confirmation Model. The new alert represents the 35th signal since 1922.
While less timely, I prefer the monthly composite trend model over the daily and weekly versions because it eliminates intra-month noise, which helps me to see the big picture more clearly.

How I construct the monthly version of the composite trend model
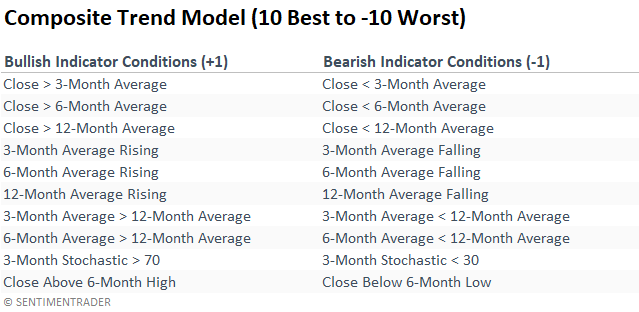
The composite assigns an individual score of +1 or -1 to each component in the model based on the following conditions.
Similar trend change signals preceded outstanding results
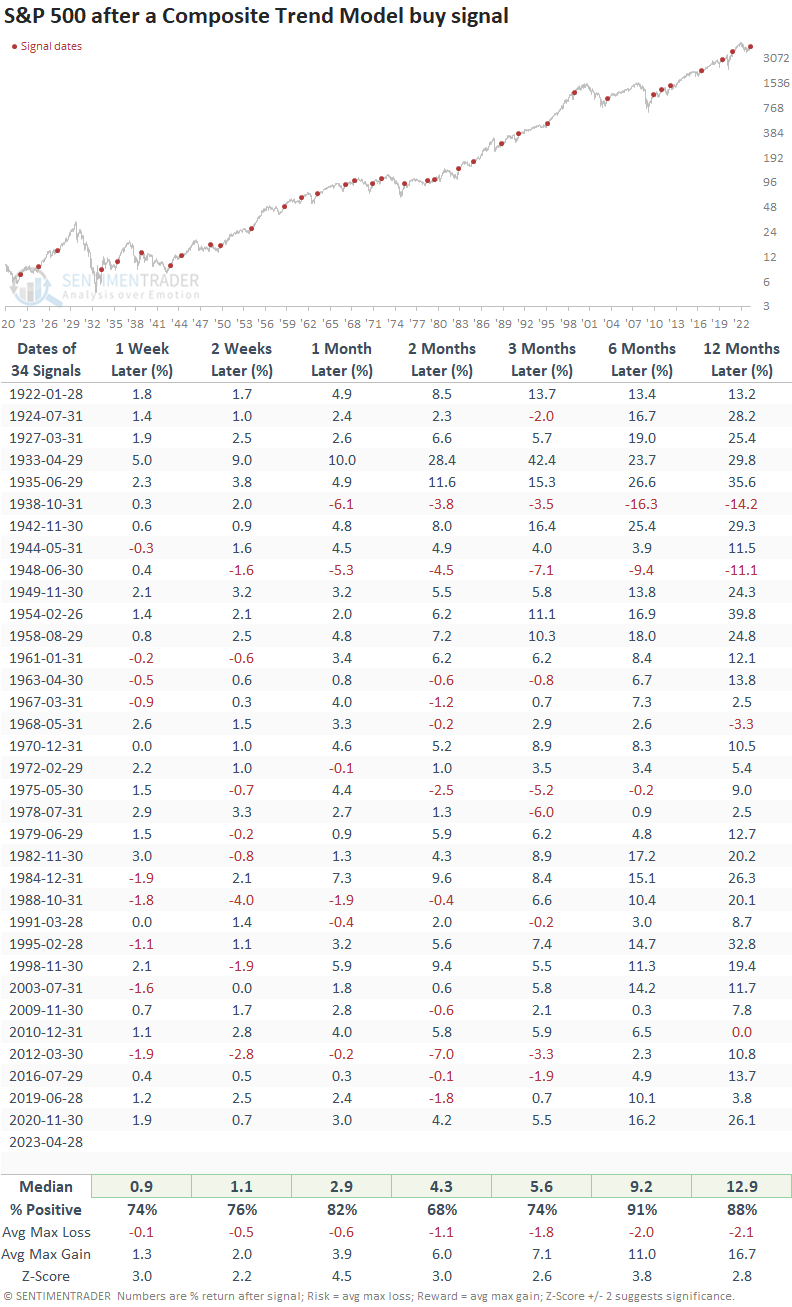
When the composite trend model cycles from -4 or worse to +9 or better, the S&P 500 rose 91% of the time over the next six months. Since 1922, only two signals showed a loss in the six and twelve-month time frames, both in the pre-1950 era.
Max loss signals > -10%
The number of max loss signals greater than -10% over the next six and twelve months was minimal, with only two and four precedents.

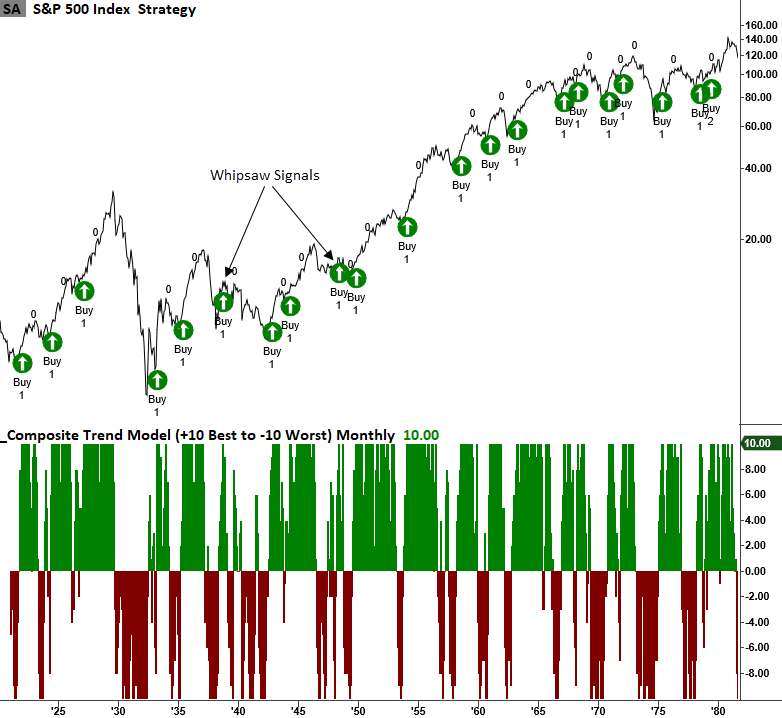
A chart-based perspective for the two worst six and twelve-month drawdown signals
I continue to be in the camp that if the S&P 500 records a lower low, the 1946-49 period is the most likely analog for the current environment.
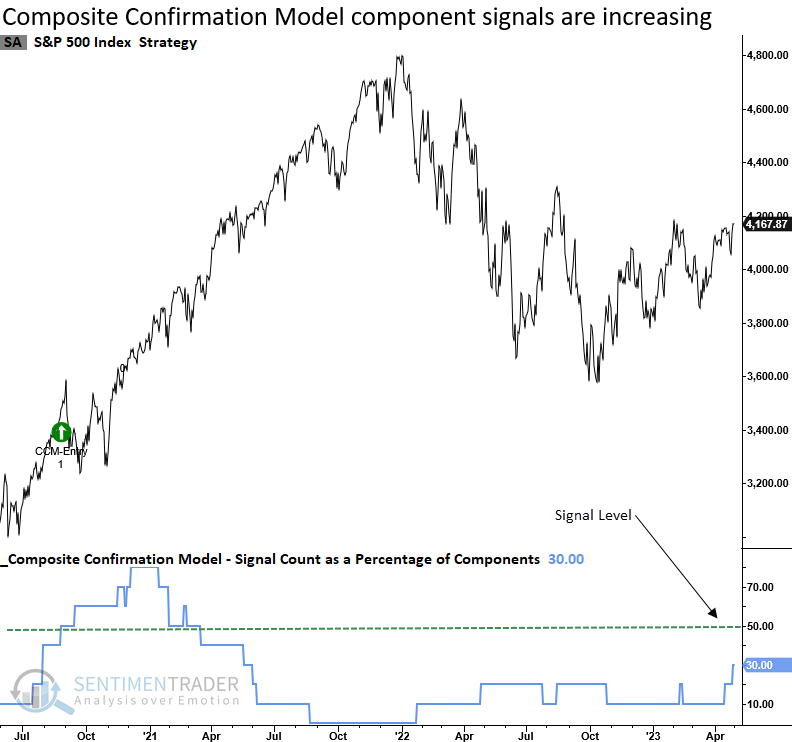
TCTM Composite Confirmation Model
The Composite Confirmation Model signal count increased to 30% with the new trend change signal. While still below the threshold level for an alert, it's moving in the right direction.
What the research tells us...
A composite trend model for the S&P 500 reversed from a bearish to a bullish trend score, triggering a buy signal for a member in the Composite Confirmation Model. After similar composite trend change signals, the S&P 500 rose 91% of the time over the next six months. Drawdowns greater than 10% were minimal and occurred before 1950. The Composite Confirmation Model signal count increased to 30% with the new trend change alert. While below the threshold level for a signal, the weight of the evidence continues to build in favor of the bulls.

