
A cluster of trend score thrusts suggests a bullish outlook for stocks

Key points:
- The S&P 500's trend score rose four points over five days, triggering a buy signal
- Similar trend shifts saw the S&P 500 rise 86% of the time over the subsequent year
- The Nasdaq 100 also registered a buy signal when its trend score jumped four points
An increasing number of stock indexes are showing signs of a bullish trend shift
Last week, I highlighted a bullish trend shift for the Nasdaq Composite, indicating a sudden alignment among multiple trend-following indicators. This trend score surge occurs when the composite increases by four or more points over five days, proving to be a timely signal for momentum regime changes, often preceding sustained directional moves.
Further supporting the shift from a downtrend to an uptrend, the S&P 500 and Nasdaq 100 saw notable increases in trend scores, marking their first net change signals since the recovery from the 2022 bear market.
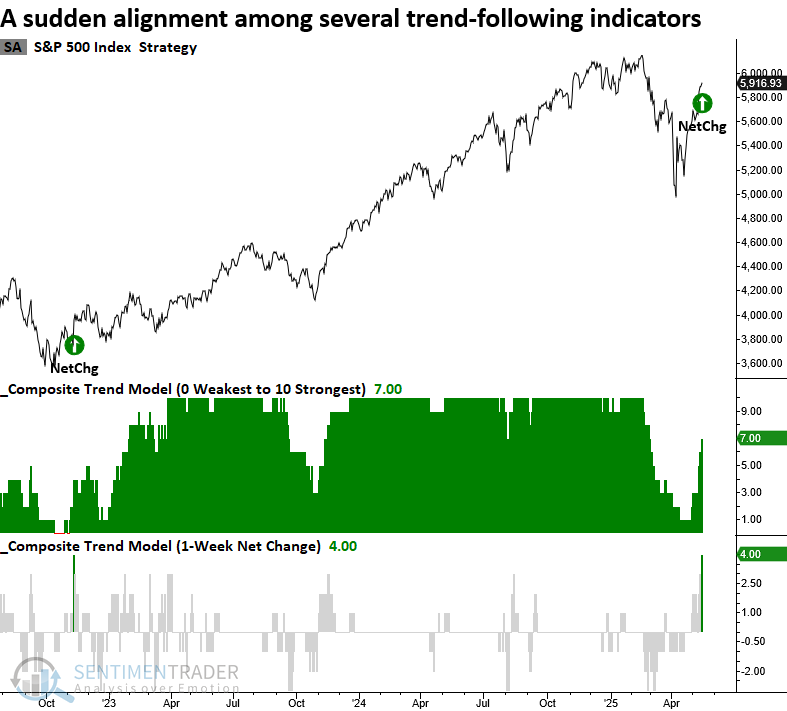
Two additional conditions are required to trigger the signal: the trend score must reset below 2, and the index must show positive short-term momentum alongside the net change surge.
Comparable trend score shifts preceded excellent returns and consistency
Whenever the S&P 500's trend score climbed by four points over five days, the world's most benchmarked index displayed excellent returns and consistency over the next year. Furthermore, four out of seven horizons exhibited significance relative to random returns.
Of the five instances when the S&P 500 declined a year later, all but one,1965, occurred during a well-established downtrend, with signals emerging 169 to 584 days after the peak. By contrast, the latest signal emerged just 61 days from the high.
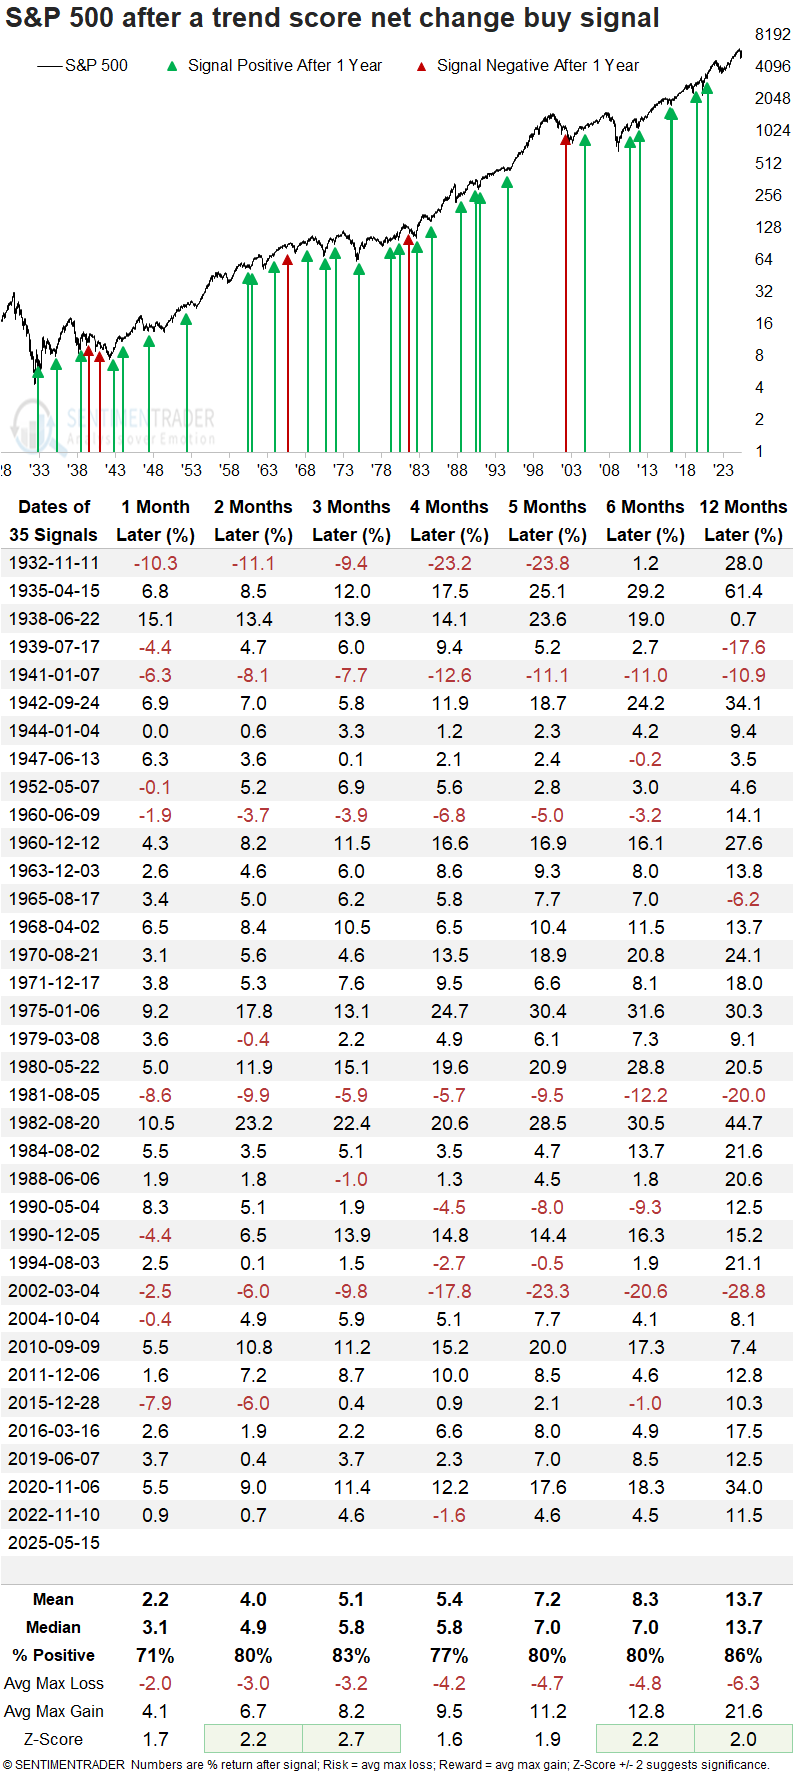
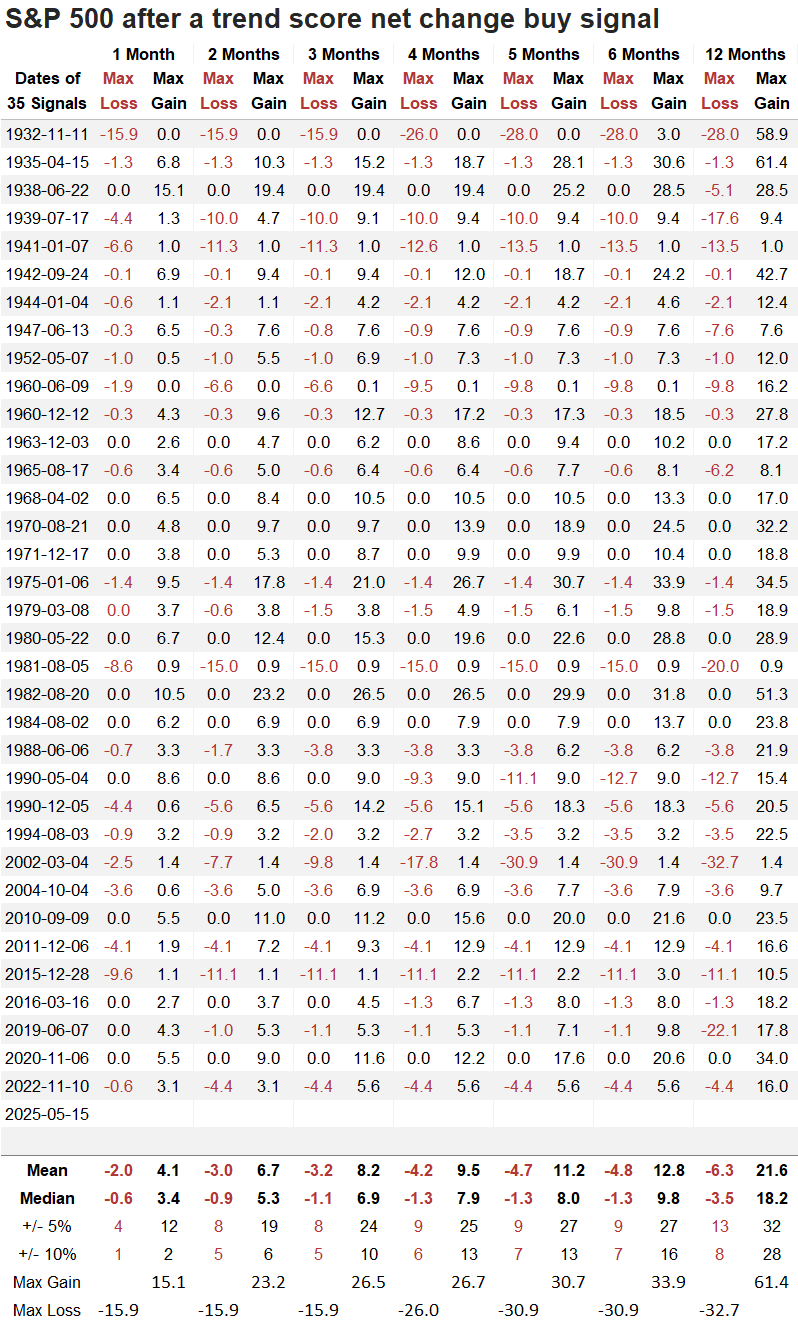
A year later, the S&P 500 declined more than 10% only eight times. In contrast, it posted rallies of over 10% in 28 cases, suggesting a favorable risk/reward scenario.
Trend indicators for a tech heavyweight shift bullish
The Nasdaq 100, widely traded through the QQQ and levered ETFs like TQQQ, also triggered a trend score net change signal, the first occurrence since January 2023.
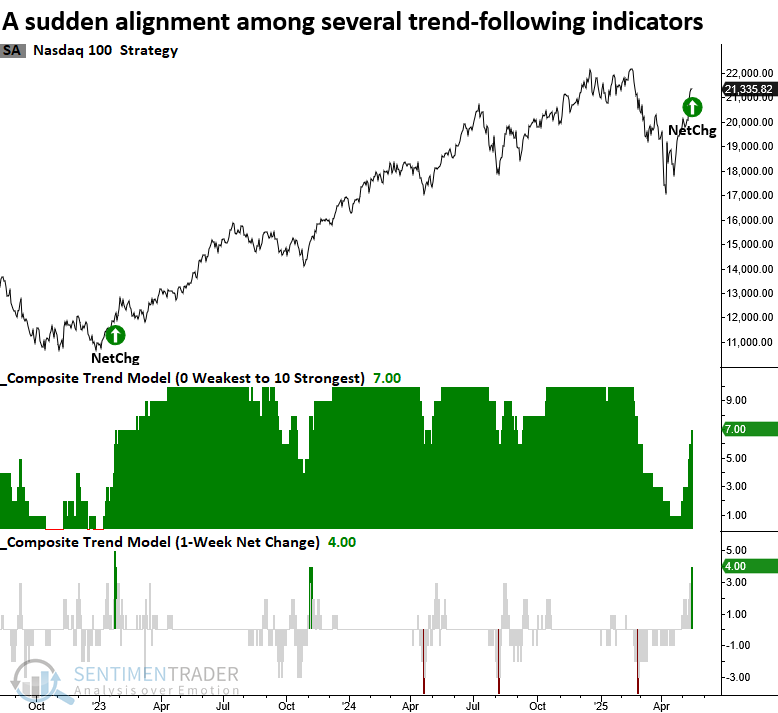
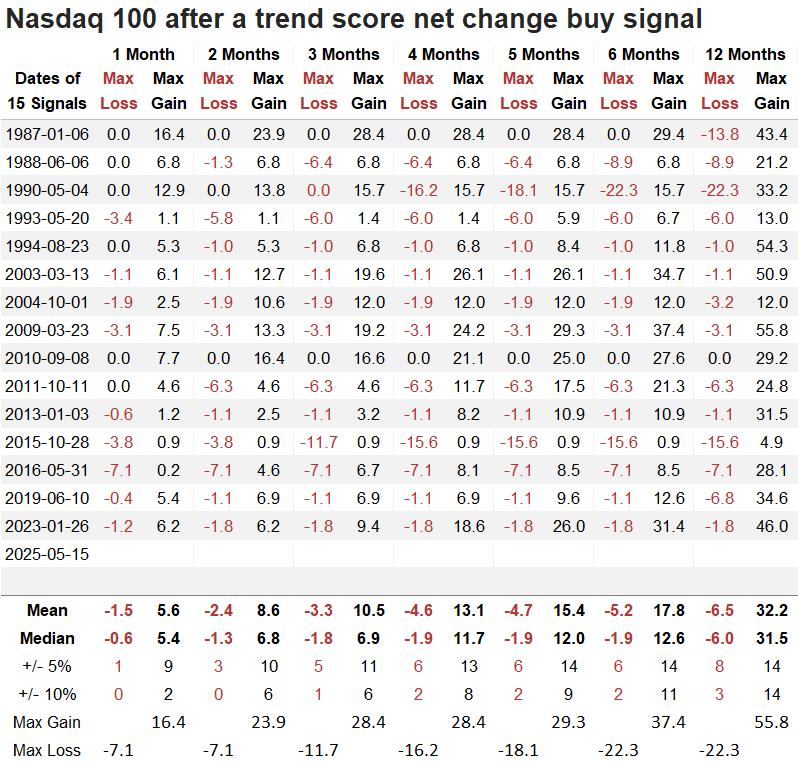
The Nasdaq 100 posted strong and consistent gains after a trend score surge, advancing in all but one instance over the next year, with the sole decline a negligible -0.02%.
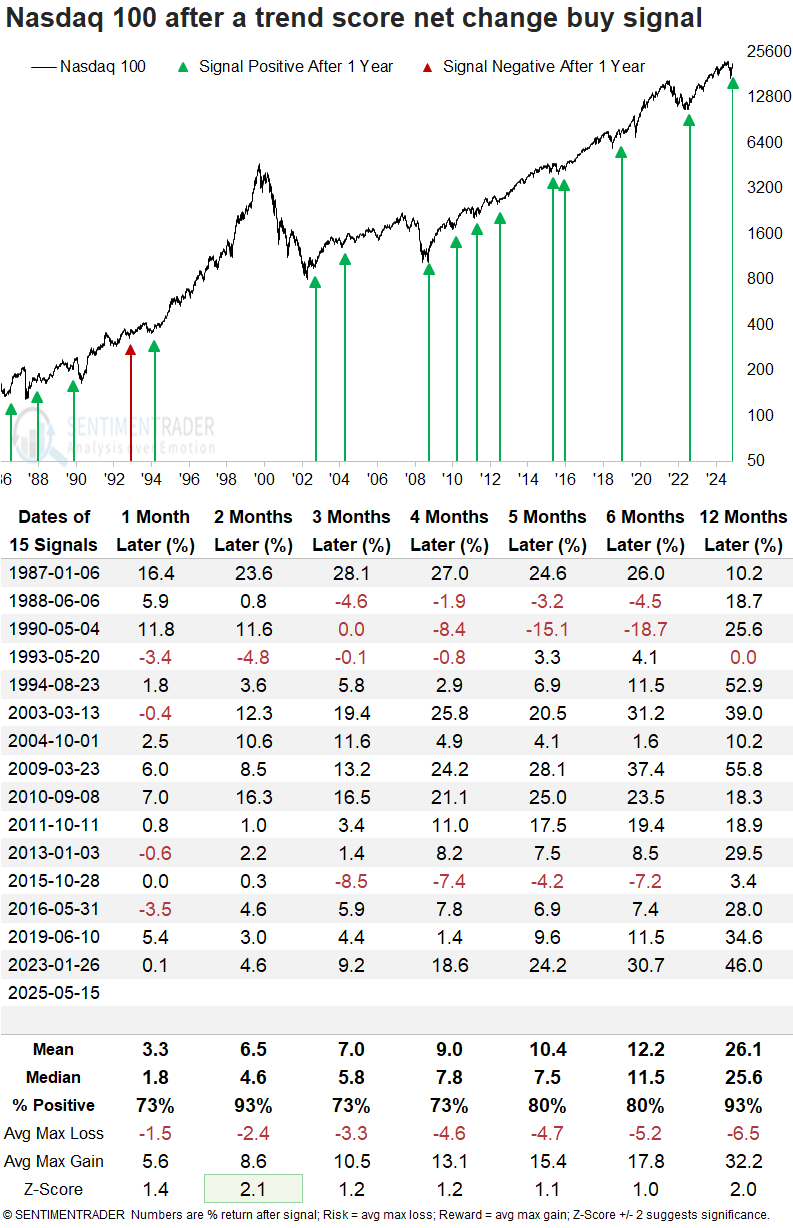
A year later, the Nasdaq 100 dropped more than 10% just three times but rose more than 10% on 14 occasions, pointing to a strong upside bias.
When Nasdaq 100 signals are extended to the S&P 500 and its sectors, it shows the world's most benchmarked index rose 100% of the time a year later, with technology outperforming all groups.
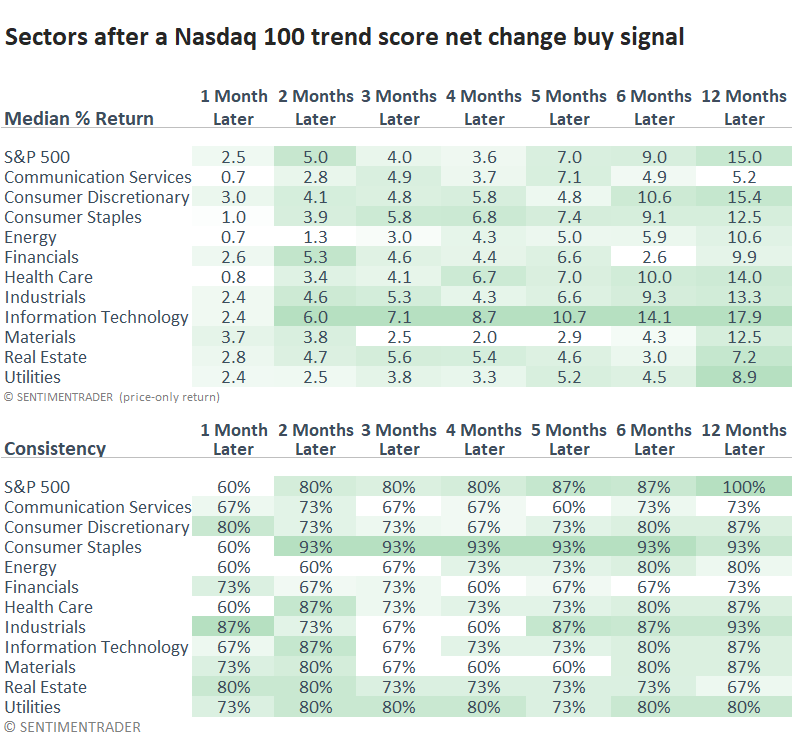
It's worth noting that the S&P 500 Technology and Consumer Discretionary sectors generated trend score signals, reinforcing the broader strength among growth-oriented groups. Meanwhile, value-oriented sectors like Industrials and Financials failed to register a signal.
What does the weight of the evidence suggest?
The number of positive research reports I've published has outnumbered the number of negative ones, suggesting that the weight of the evidence leans bullish.
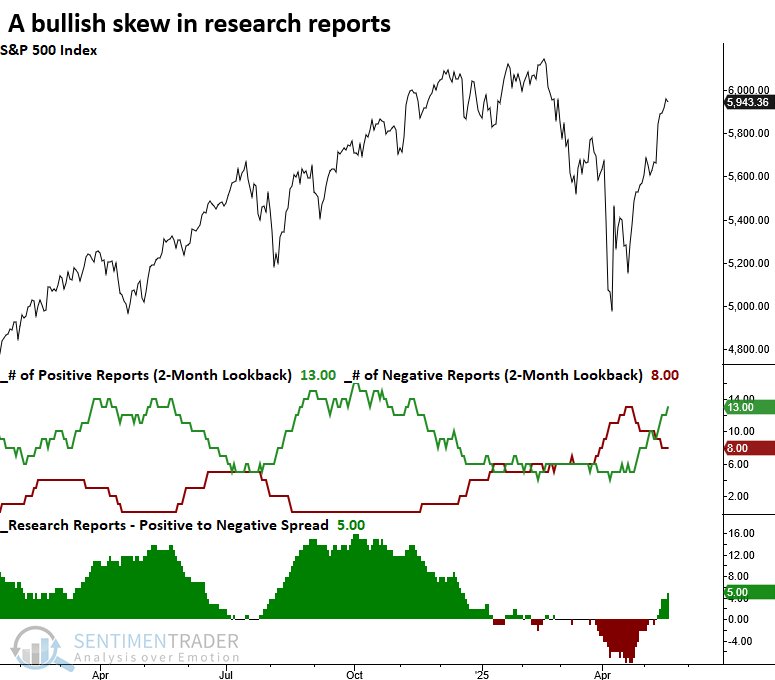
These rolling cumulative indicators compare a signal's returns and consistency to the study period results over one-to six-month horizons to determine whether a report is bullish or bearish. The indicators are exclusively based on S&P 500 signals.
What the research tells us...
A composite incorporating ten trend-following indicators recently experienced a significant upward shift, triggering a buy signal for the S&P 500. Comparable signals have led to favorable outcomes, with the world's most benchmarked index rising 86% of the time over the following year and posting a median gain of 13%. A similar signal was also triggered for the Nasdaq 100, which has shown even more compelling forward returns. In past instances, the Nasdaq 100 advanced in all but one case over the next 12 months, highlighting the strength and consistency of this trend-based setup across major equity benchmarks. The weight of the evidence continues to build in favor of the bulls.