
A closer look at the Macro Index Model

Key Points
- The U.S. stock market and U.S. economy move in the same direction in the long term
- Major bear markets begin to unfold when the market senses impending economic weakness
- Certain indicators are beneficial in foreshadowing the future economic trend
- Our Macro Index Model (MIM) combines 11 diverse economic indicators to assess the likely future trend of the U.S. economy
- Long-term investors typically should not fret about the economy or stock market performance as long as MIM holds above 0.70
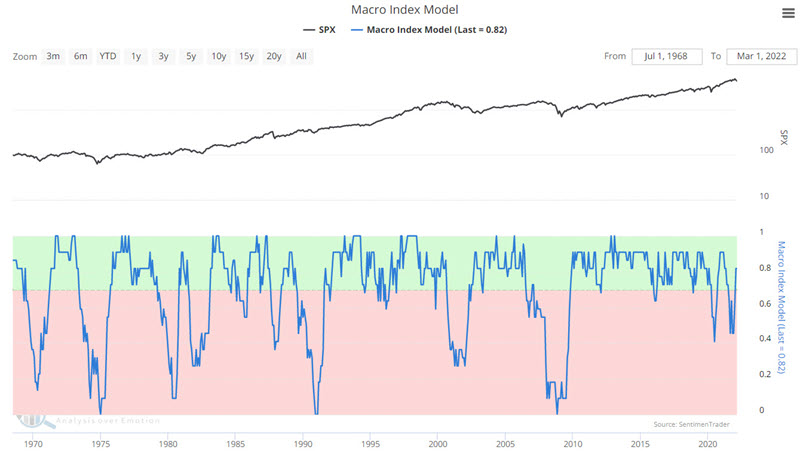
The Macro Index Model
The chart below displays the S&P 500 Index along with our Macro Index Model. In the simplest terms possible, higher readings are considered favorable for the economy and the stock market and vice versa. The basic rules for using this model are simple: If MIM > 0.7, be bullish on stocks, and if MIM < 0.7, be bearish on stocks.
Our Macro Index Model is updated on the first day of the month and evaluates the status of the sensitive 11 economic indicators listed below to determine the state of the U.S. economy:
- New Home Sales
- Housing Starts
- Building Permits
- Initial Claims
- Continued Claims
- Heavy Truck Sales
- 10 year - 3-month Treasury yield curve
- S&P 500 vs. its 10-month moving average
- ISM manufacturing PMI
- Margin debt
- Year-over-year headline inflation
What the Macro Index Model tells you
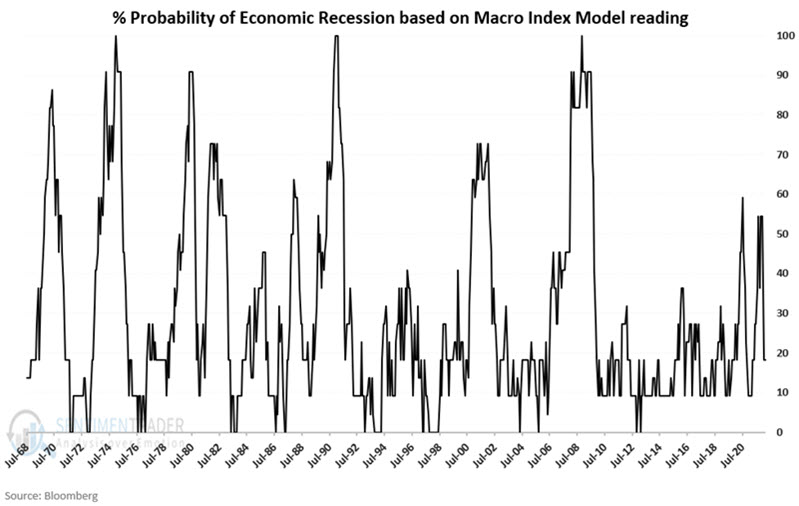
In essence, MIM assesses the likelihood of an economic recession in the near term. To illustrate, let's flip the index on its head. The chart below is derived by calculating (1.00 - the latest MIM reading) x 100. With the latest reading at 0.82, we get (1.00 - 0.82) x 100 = 18. In other words, the probability that we are presently in an economic recession is 18%.
This current low probability probably comes as a shock to most investors. Given the recent turmoil regarding inflation, energy prices, and geopolitics, many investors are convinced that the likelihood of an impending recession is roughly 150%! But the cold, hard, and objective numbers are what they are. Granted, things could change as early as the 1st of April. But objective analysis - and not relying on hype and fear is generally what separates the winners from the losers in the long run.
Repeating, when the economy is in a recession, the stock market reacts poorly as corporate sales and profitability are inevitably pinched.
Now let's go back to using MIM in its original form, with high readings being favorable and vice versa.
A closer look at market performance based on MIM readings
Suppose the underlying theory is that stocks perform better when the economy is strong and perform worse when the economy weakens. In that case, we should expect to see strong stock market returns when MIM readings are high and vice versa. As it turns out, that is pretty much the case - with one interesting exception.
For testing purposes, we will break MIM readings into 10 "buckets" - .90 to 1.00, .80 to .899, .70 to .799, .60 to 699, etc., going back to 1968. The table below displays the cumulative S&P 500 Index % price gain or loss while MIM is in a particular bucket.
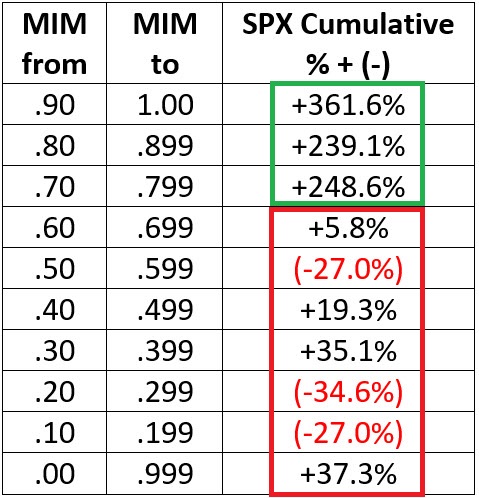
The results in the table above illustrate clearly why the .70 level is critical - with robust gains for the three top buckets and mixed results for all lower levels. As an aside, it is interesting to note that among the buckets below .70, the best stock market performance (+37.3%) occurred when the MIM reading was at its lowest level, i.e., below .10. This appears to be a case of "when things are so bad, they are good." In other words, the stock market typically begins to rally as the economy is bottoming out in anticipation of better economic days ahead. Readings in this lowest bucket occurred in the mid-1970s, the early 1980's, the early 1990's and in 2008 - all of which ultimately proved to be terrific buying opportunities (of course, getting to that point was always preceded by some true economic and stock market ugliness - so "be careful what you wish for.")
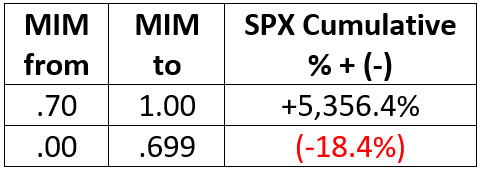
To summarize the results from 1968 into 2022, see the table below.
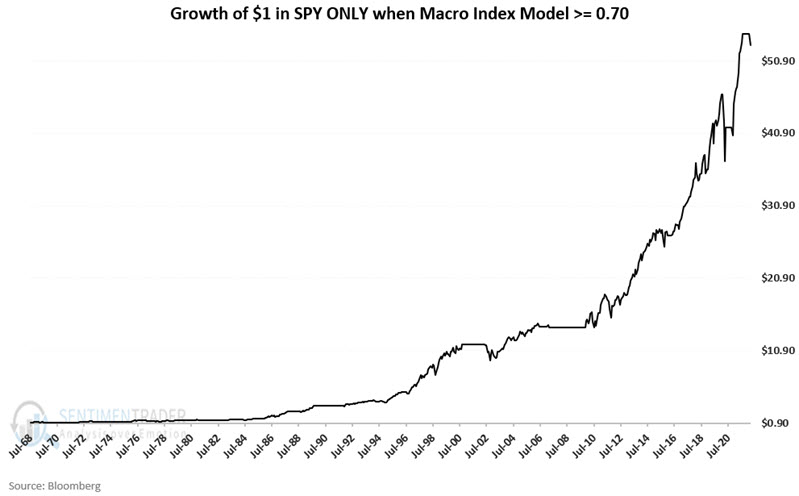
The chart below displays the growth of $1 invested in the S&P 500 Index only when MIM is .70 or above.
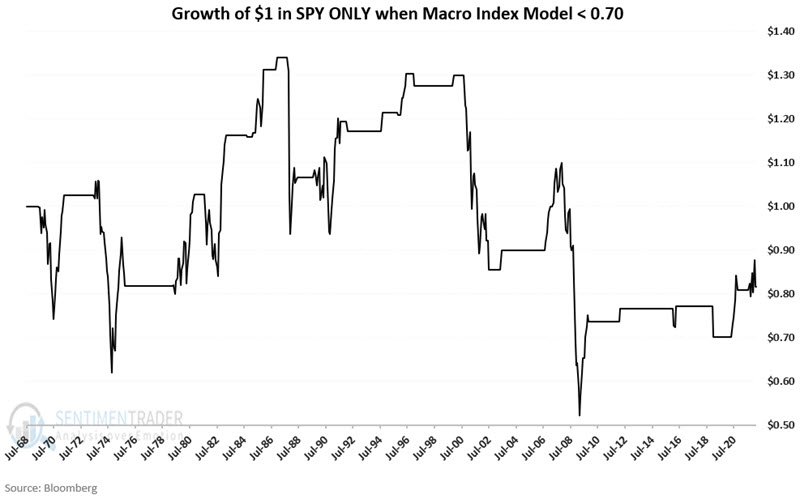
The chart below displays the growth of $1 invested in the S&P 500 Index only when MIM is below .70.
The financial and psychological benefit of the Macro Index Model
The potential financial benefit is illustrated in the charts above. Investing heavily when MIM is .70 or above and eschewing large positions when MIM is below .70 and investors may increase their potential for generating gains and avoiding more significant losses.
There is also a potential psychological benefit. One of the easiest mistakes to make is to follow the latest financial news and to form a subjective opinion about "what happens next with the economy." Gloom and doom seem the stock in trade of the financial press. As a result, it is easy to develop a fatalistic attitude and convince oneself that the economy is worse off.
This is where the Macro Index Model comes in. By noting the value for this fully mechanical index on the first day of each month, you can a) objectively assess with a high degree of historical accuracy how great the likelihood of a recession is and b) ignore the endless plethora of "economic news and opinion" that will come your way in the month ahead.
What the research tells us…
When you boil it down, stock market performance hinges on the strength of the overall economy. When the economy is strong, companies can grow their sales and earnings, which ultimately translates into higher stock prices.
When the economy weakens, the result is typically a decline or flattening corporate sales and earnings. As a result, a bear market for stocks usually ensues when the stock market gets a whiff of recession.
When the Macro Index Model is below .70, and stock prices are weak, investors should err on the side of caution, as a drawn-out bear market is more likely when the economy shows clear, objective signs of weakness. On the flip side, stock market declines that occur in the face of high MIM readings are typically - though not always - best viewed as buying opportunities.