
A closer look at S&P 500 fourth quarter seasonality

Key points
- The S&P 500 is entering arguably the most favorable seasonal time of the year
- Historical odds favor the stock market during this period, BUT DO NOT guarantee anything on a year-to-year basis
The fourth quarter favorable seasonal period
The chart below displays the annual seasonal trend for the S&P 500 Index. The obvious thing to note is the period highlighted in the green box. This period extends from the close of Trading Day of Year #197 through the end of the calendar year. For 2023, this period extends from the close on 2023-10-13 through 2023-12-31.
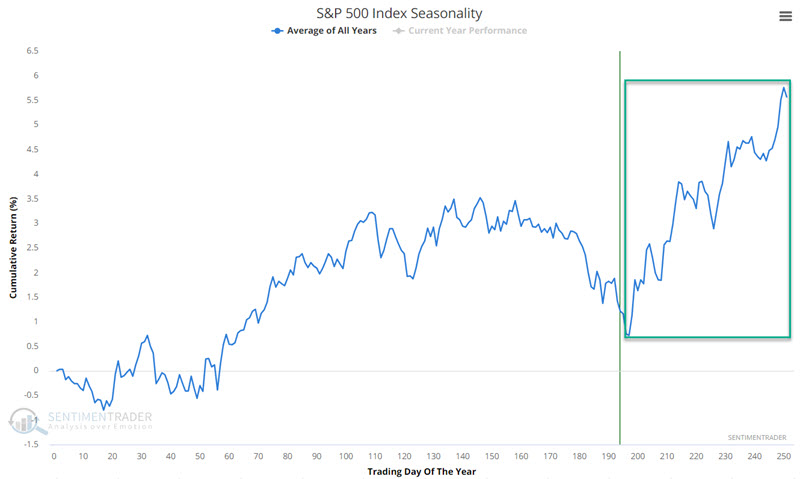
It looks pretty encouraging and tends to give hope to investors and traders who give any credence at all to seasonality. And as we will see shortly, this is for good reason. However - and just as importantly - no matter how many times pundits shout about "bullish seasonality", a bullish stock market during the fourth quarter is not guaranteed.
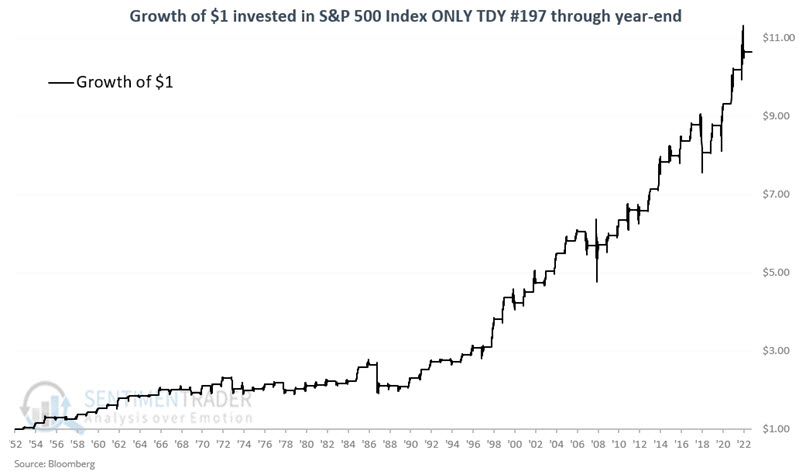
To wit, the chart below displays the growth of $1 invested in the S&P 500 Index each year only from the close of TDY #197 through the close of the last trading day of the year. Before 1953, the stock market was open on Saturday (shhh, don't give anyone any ideas), so there were roughly an additional 52 trading days each year. For our purposes, we will start our test in October 1953.
The chart below displays the same results as above on a logarithmic scale.
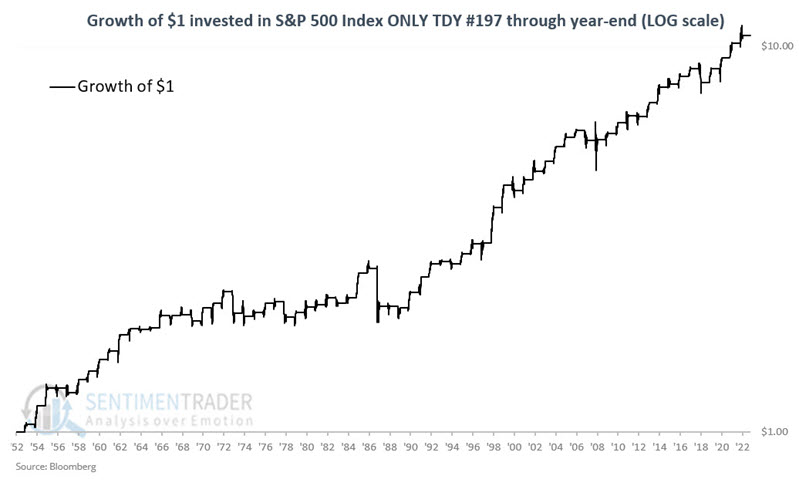
Just eyeballing the chart above gives good news and bad news. The good news is that the long-term trend from lower left to upper right is well established. The bad news is that there are plenty of downdrafts along the way.
The bottom line: It is correct to say that the stock market has a strong tendency to rally during the fourth quarter of the year. It is NOT correct to say that investors should be counting on a rally in the months ahead based solely on seasonality - we are talking about a historical tendency and not a sure thing as some purveyors of seasonality might have you believe.
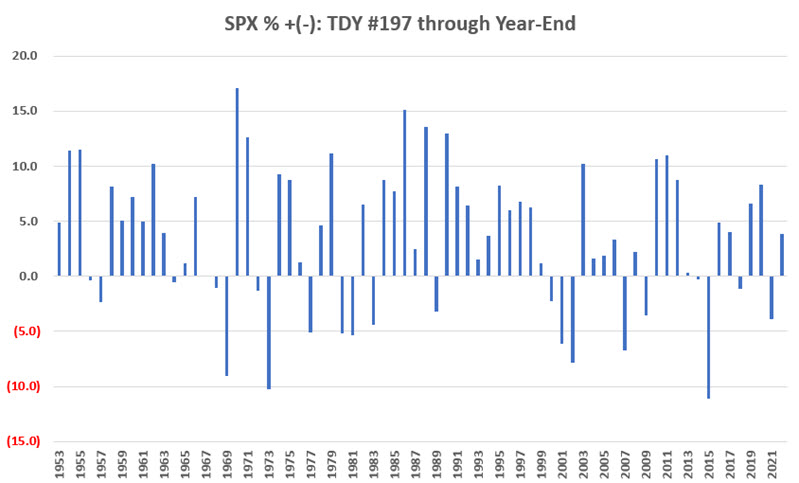
The chart below displays year-by-year results and offers the same tradeoff as the chart above - i.e., the stock market is up far more often than not, BUT with some significant declines interspersed, including multiple down years back-to-back.
The table below summarizes the S&P 500 post-TDY 197 performance.
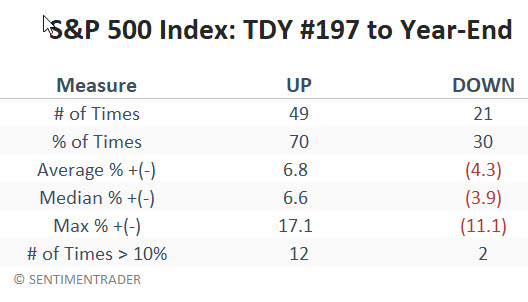
The 70% Win Rate reminds us this is far from a sure thing. However, the higher Average and Median % return for up years over down years AND the 12 to 2 advantage for up years when it comes to moves of greater than 10% remind us to give the bullish case the benefit of the doubt as long as the market is acting reasonably well.
What the research tells us…
Some people can get a little carried away regarding seasonality ("Hi, my name is Jay"). But in reality, seasonality is like any other market indicator. Sometimes, it works exactly as hoped, and other times, it does not work at all. Seasonality is best used to tell you "when to look where" and to add weight to the bullish or bearish case for a given market. It is rarely a good idea to rely on seasonality as a standalone model. The results detailed above tell us to look closely at the stock market during the fourth quarter of the year and to give the bullish case the benefit of the doubt (and to question random fearful narratives). Nevertheless, the fact that we can draw a green box in the first chart above does not relieve us as investors and traders of our responsibility to intelligently allocate capital and ruthlessly manage risk.