A chart looks nice, but...

There's no doubt that Friday's reversal looks impressive. On a chart, there is no more classic sign of selling exhaustion than a big intraday about-face after days of pressure.
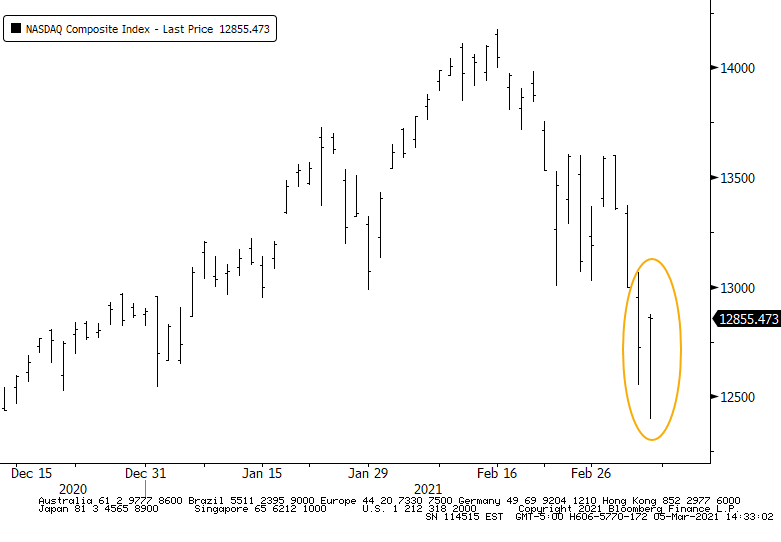
The problem is that charts are ripe for cherry-picking and self-delusion. Let's go back as far as we have intraday day for, 1989, and look for every time the Nasdaq Composite suffered at least 4 days of intraday declines of more than 1%, fell to at least a 50-day low, and on the last day reversed the selling pressure to close in positive territory.
This kind of reversal has not been a consistent predictor of a sustained end to selling pressure. Over the next month, the Nasdaq showed a positive return only 41% of the time. In the last decade, it has been more consistent, so bulls have to hope we're in the same kind of environment.
What else we're looking at
- Full returns after other "key reversal days" in the Nasdaq
- What happens after major "splits" in the market
- A look at using other indexes to take advantage of election cycle seasonal tendencies

| Stat Box By Thursday, 74% of stocks in the Nasdaq 100 were in a correction, down more than 10% from their peaks. That's the highest percentage of stocks in a correction since April 21. |
Etcetera
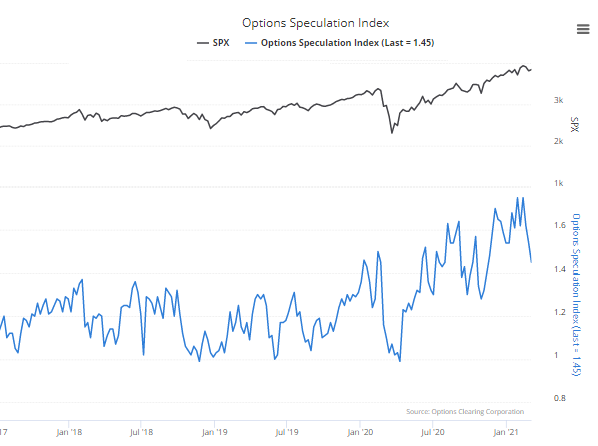
Options traders pull back...a little. Last week, options traders in the U.S. executed 45% more bullish options strategies than bearish ones. That's down from the peak levels a few weeks ago, but remains above other extremes from 2000. Source: OCC
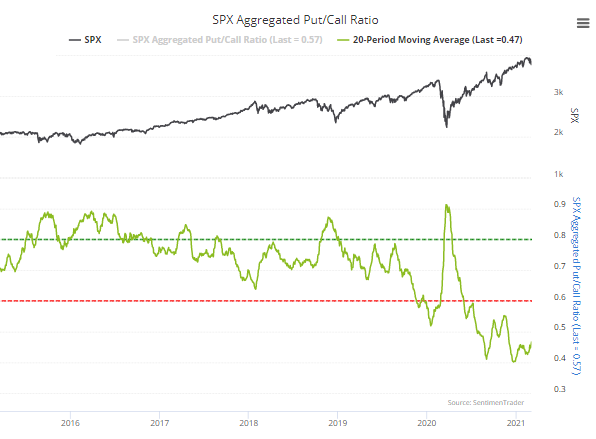
A few more puts. Among all member stocks of the S&P 500 index, traders have still focused more on calls than puts, though the 20-day average of the Aggregated Put/Call Ratio is now rising. A rising ratio tends to happen during declining markets, until it reaches an extreme. Source: SentimenTrader
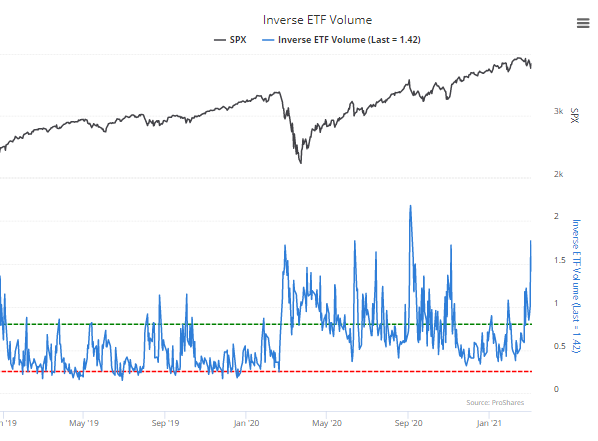
At least a little fear. The volatility to end last week triggered a spike in volume among inverse ETFs, those funds that profit when stocks decline. Recent days have seen this volume account for a large enough amount of overall volume that it equated with other very short-term panics in the past few years. Source: Fund companies, NYSE