
A bullish win streak for the S&P 500

Key points:
- The S&P 500 closed above its 10-day average for 21 consecutive trading days
- Similar win streaks over the past 95 years preceded solid returns and win rates
- Signals that occurred after a 252-day low showed slightly more favorable results
Win streaks typically foreshadow a bearish-to-bullish trend change
When stock indexes are in a downtrend or in the early stages of forming a bottom, price action is volatile, and indexes rarely sustain themselves above a short-term moving average for an extended period. However, when an index can hold above its average for a significant number of days after a lengthy stretch below, the market is most likely shifting to an uptrend.
To capture this bearish-to-bullish moving average reversal pattern, I created a trading signal, which is a member of the TCTM Composite Confirmation Model.
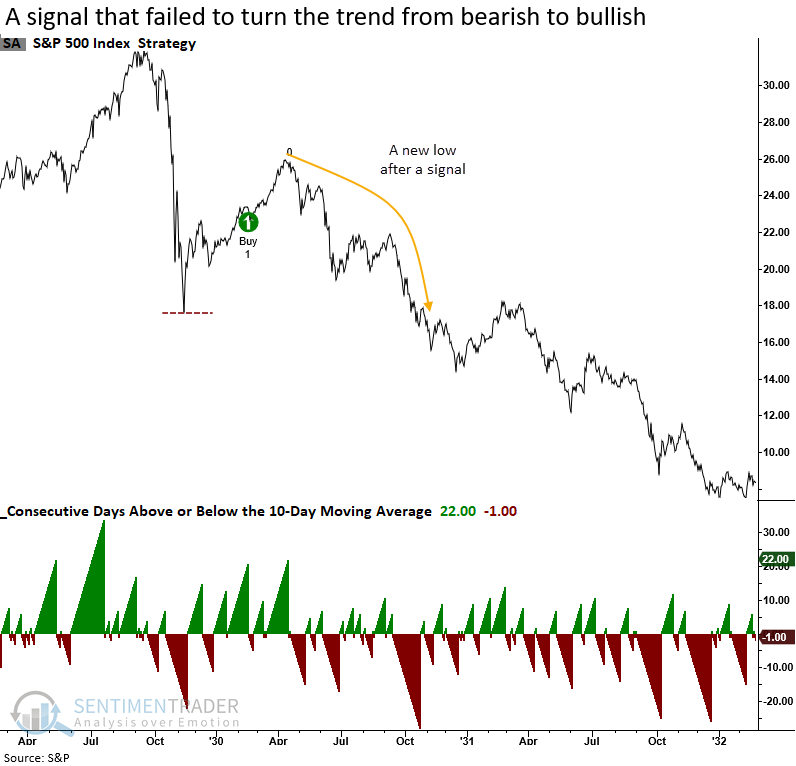
The moving average reversal model has an excellent record of avoiding whipsaw signals in bear markets. So, the untimely alert in 2022 was rare. Still, when a failure occurs, the market is more likely to correct through time, not price.
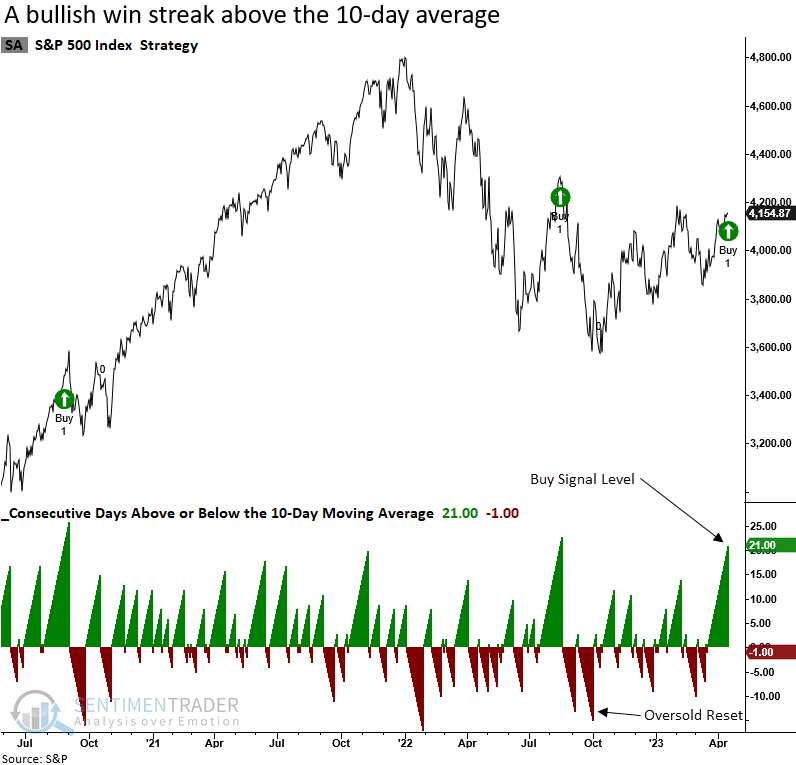
The model identifies a period when the S&P 500 closes below its 10-day average for a minimum of 12 consecutive trading days. i.e., an oversold condition. Once that setup is achieved, the system will trigger a buy signal when the Index sustains itself above the 10-day average for 21 successive trading days.
Similar win streak signals preceded consistent gains and avoided most bear markets
The moving average reversal model generated a signal 79 other times over the past 95 years. After the others, S&P 500 future returns, win rates, and z-scores were excellent across medium and long-term horizons.
Over the next six months, a max loss of greater than 10% occurred in 11 out of 79 cases. And out of those 11 instances, only one exceeded 20%. I would also note that between 1979 and 2019, a 40-year period, not one signal exceeded a 10% drawdown over that same horizon.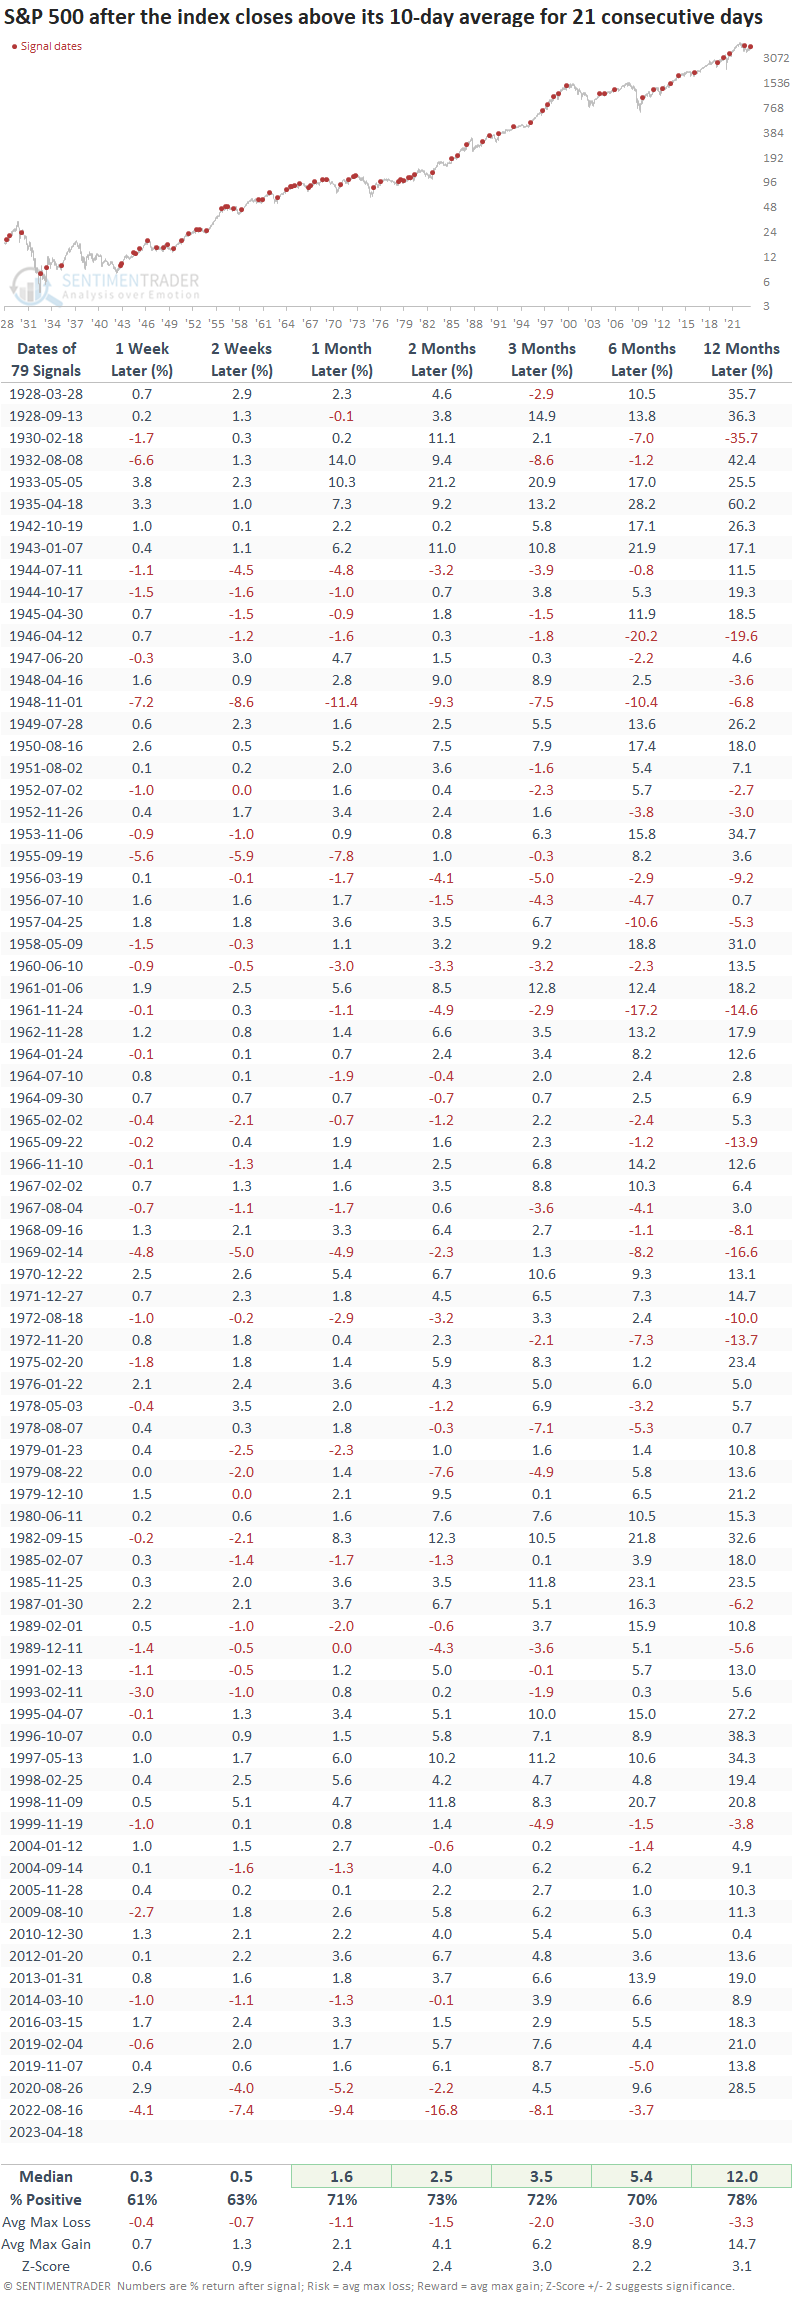
Signals after the S&P 500 closed at a 252-day low
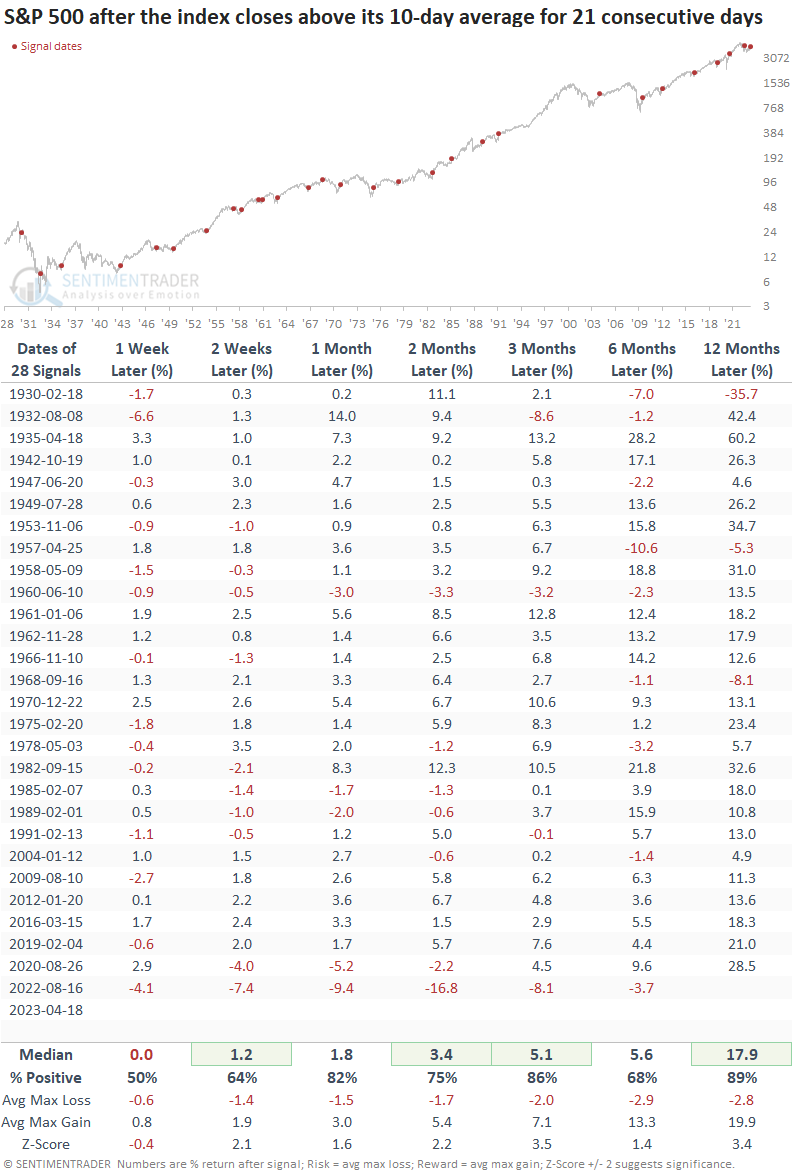
The signal from August 2022 and this most recent one occurred after the S&P 500 closed at a 252-day low. So, let's isolate precedents with that context in mind.
Signals triggered after a 252-day low show slightly more favorable results across most trading statistics, especially the 12-month win rate and return. Besides 1930, drawdowns a year later were mild.
What happens when the signal fails to turn the S&P 500 trend bullish
Since 1928, the model failed to turn the S&P 500 trend from bearish to bullish five times during a drawdown phase, including the August 2022 signal.
The 1929-32 bear market
The 1930 alert was the only one that saw the Index move meaningfully below the previous bear market low. With a second signal triggering this week, a 1929-32 scenario seems unlikely.
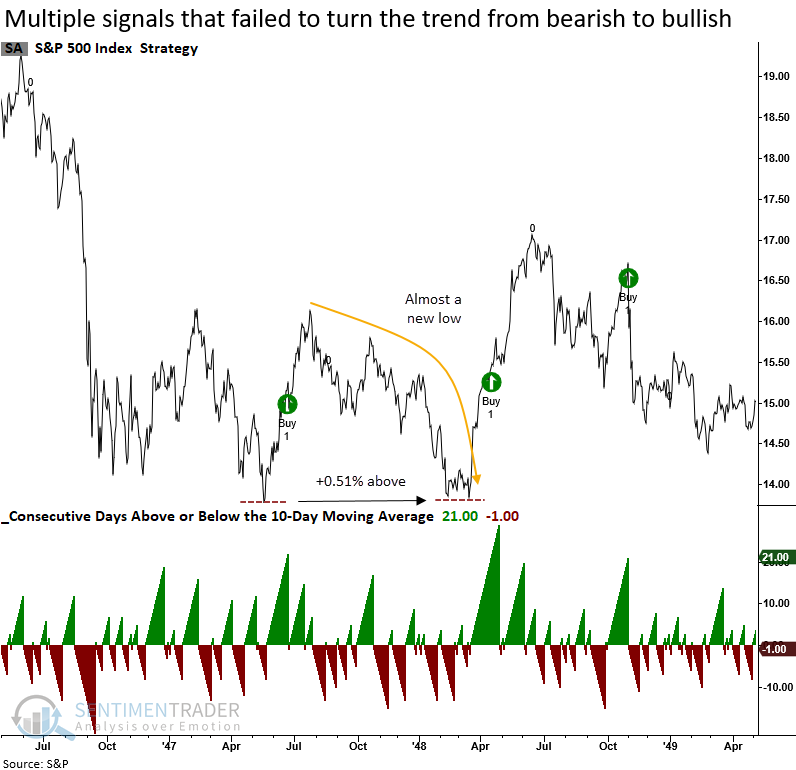
The 1946-49 bear market
The 1946-49 bear market was the only time in history when multiple signals failed to generate a new uptrend. So, if the April 2022 alert fails, a 1946-49 scenario looks more likely, which I've highlighted in other research notes.
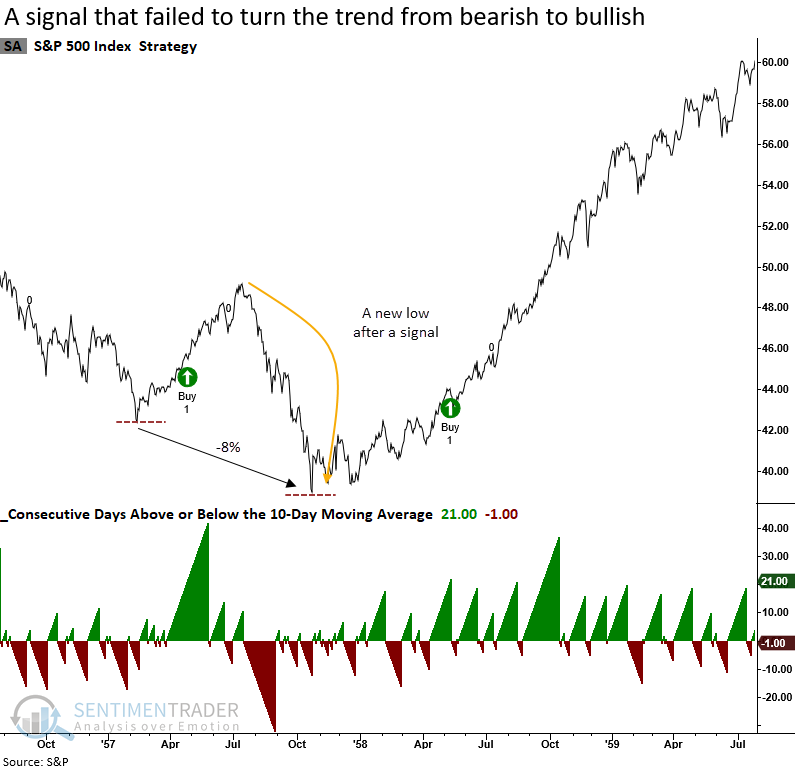
The 1956-57 bear market
While the 1957 signal undercut the previous bear market low by -8%, the second alert ushered in one of the best six-month returns for all historical instances.
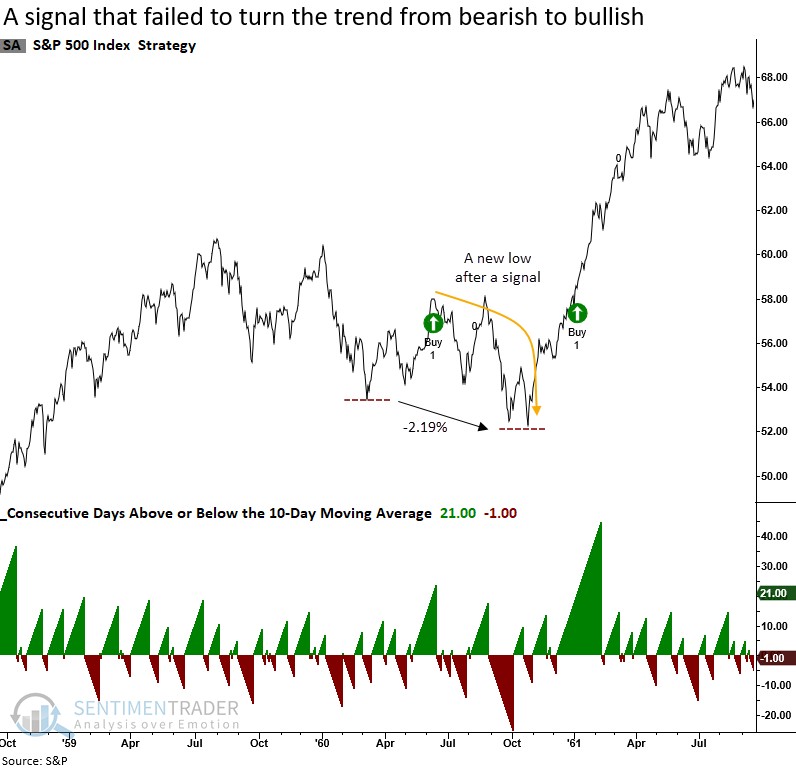
The 1960 correction/bear market
A slight undercut of the previous low was followed by a bullish second signal roughly seven months later.
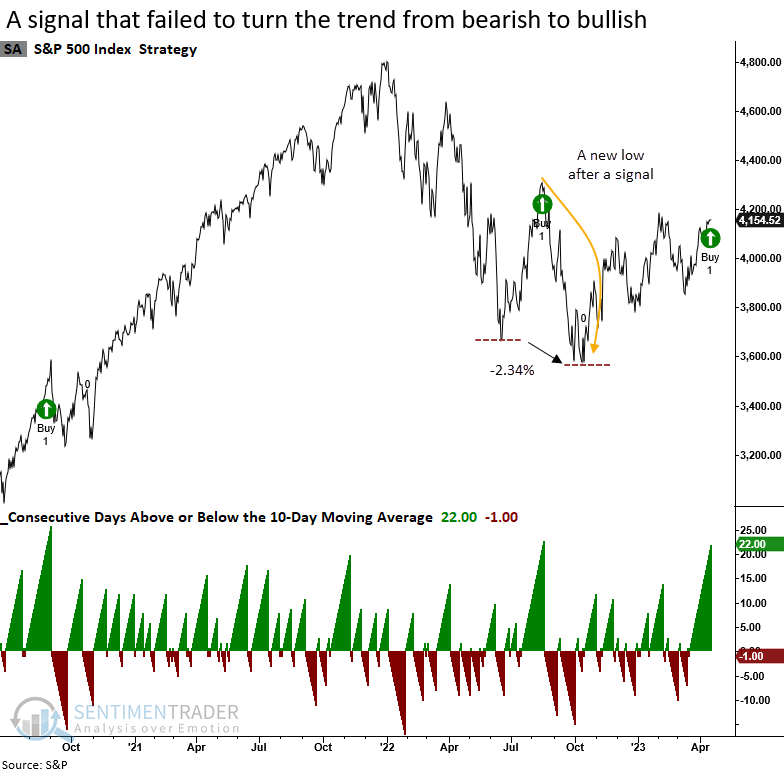
The current bear market
Similar to 1960, we see the S&P 500 barely undercut the previous bear market low and a second signal eight months later.
What the research tells us...
The S&P 500 closed above its 10-day average for 21 consecutive trading days, triggering the second buy signal for a TCTM Composite Confirmation Model component in seven months. After similar price trend alerts, returns, win rates, and z-scores for the S&P 500 were excellent across medium and long-term horizons, especially if a signal occurred after a 1-year low. Should the most recent alert fail to usher in a new bull market, a trading range similar to the 1946-49 bear market looks more likely.