
A bullish to bearish trend shift for the S&P 500

Key points:
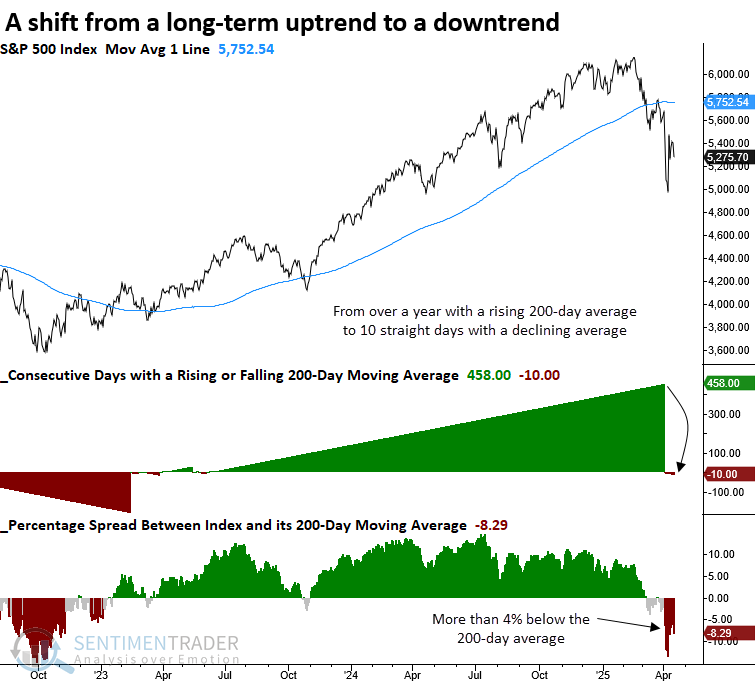
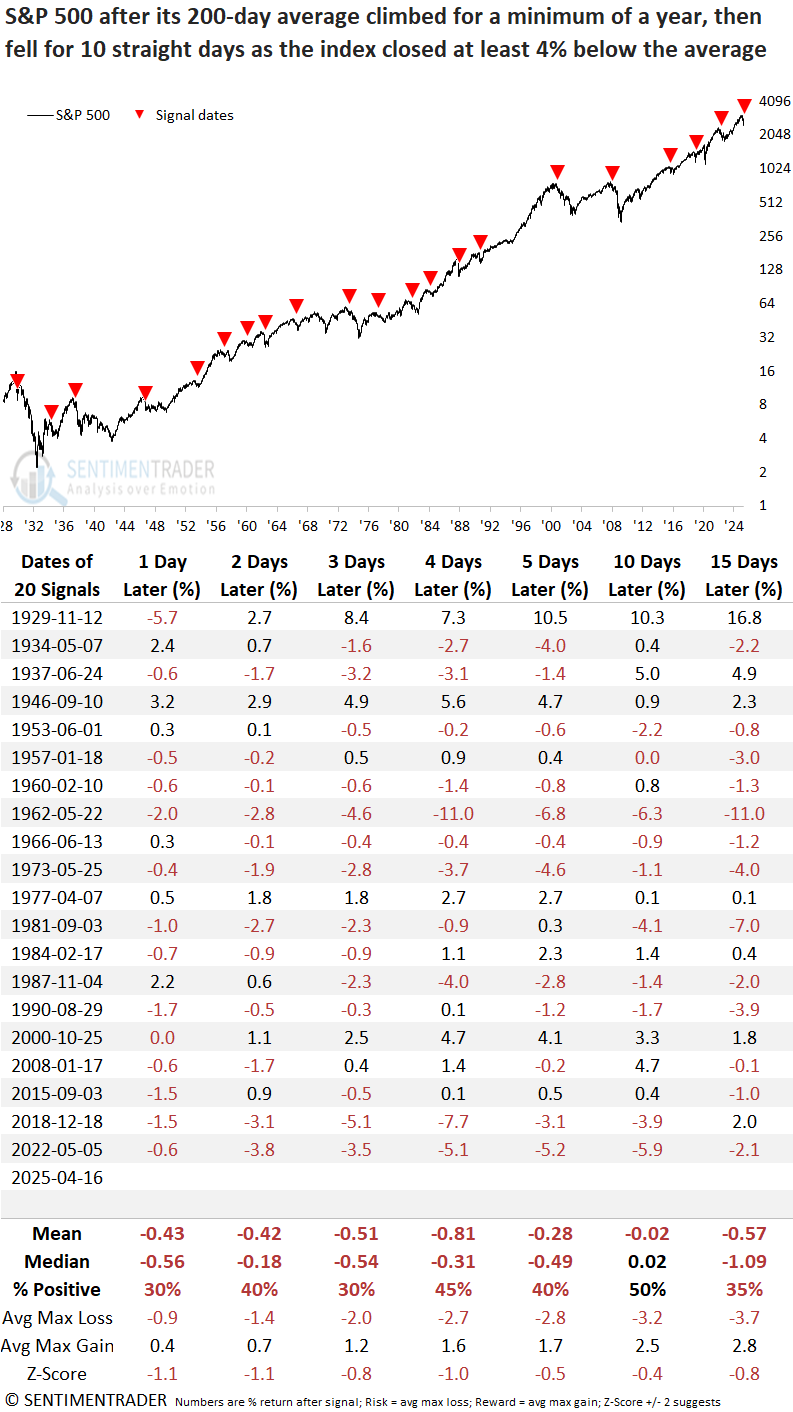
- Following a year-long rise, the 200-day average for the S&P 500 has declined for 10 straight days
- Comparable trend shifts saw the S&P 500 struggle over the subsequent year
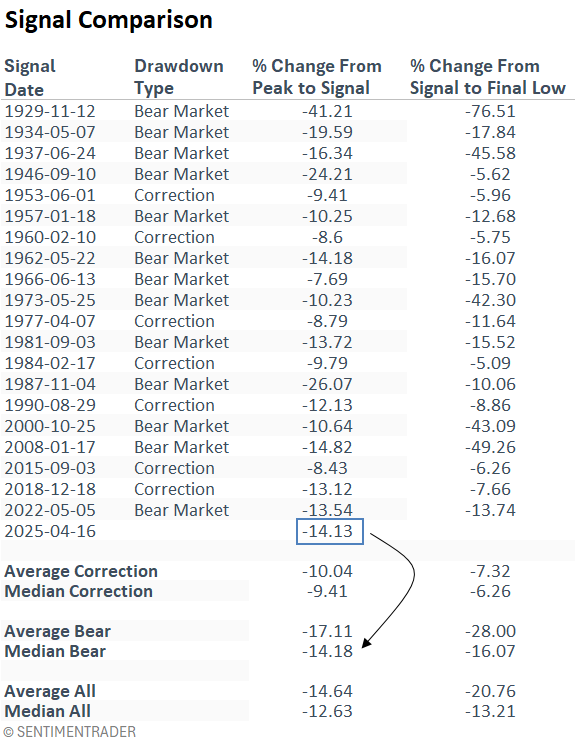
- 65% of trend shift signals occurred within the context of a bear market
One long-term trend-following indicator suggests the S&P 500 has entered a downtrend
Traders often focus on whether an asset is above or below the 200-day moving average to gauge the direction of the long-term trend. However, the slope of the moving average may offer more valuable insight. Though slower to react, this measure can filter out noise and reduce whipsaw risk.
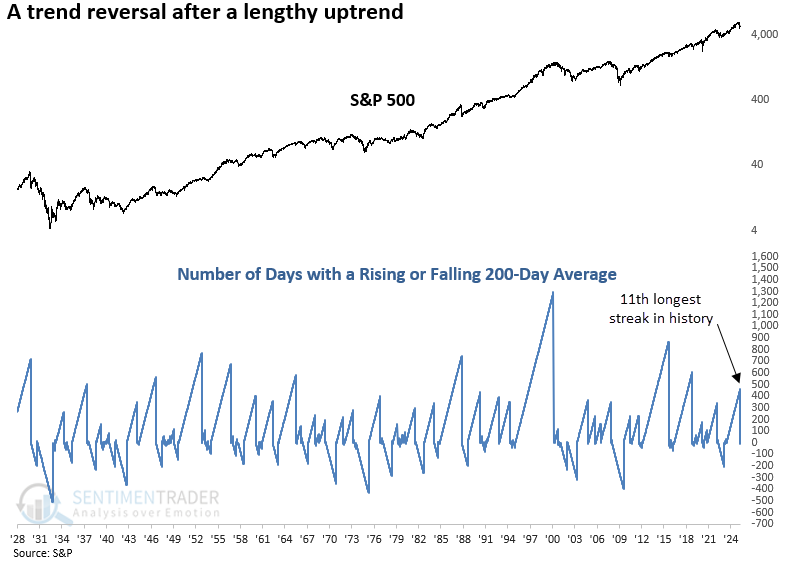
After rising for 458 consecutive trading sessions, the 11th-longest streak in history, the 200-day average for the S&P 500 has now fallen for 10 straight days, indicating that the long-term trend for the world's most widely benchmarked index has shifted to a downtrend.
The previous trend shift for the S&P 500 occurred in May 2022, resulting in a 10% drawdown over the following six months.
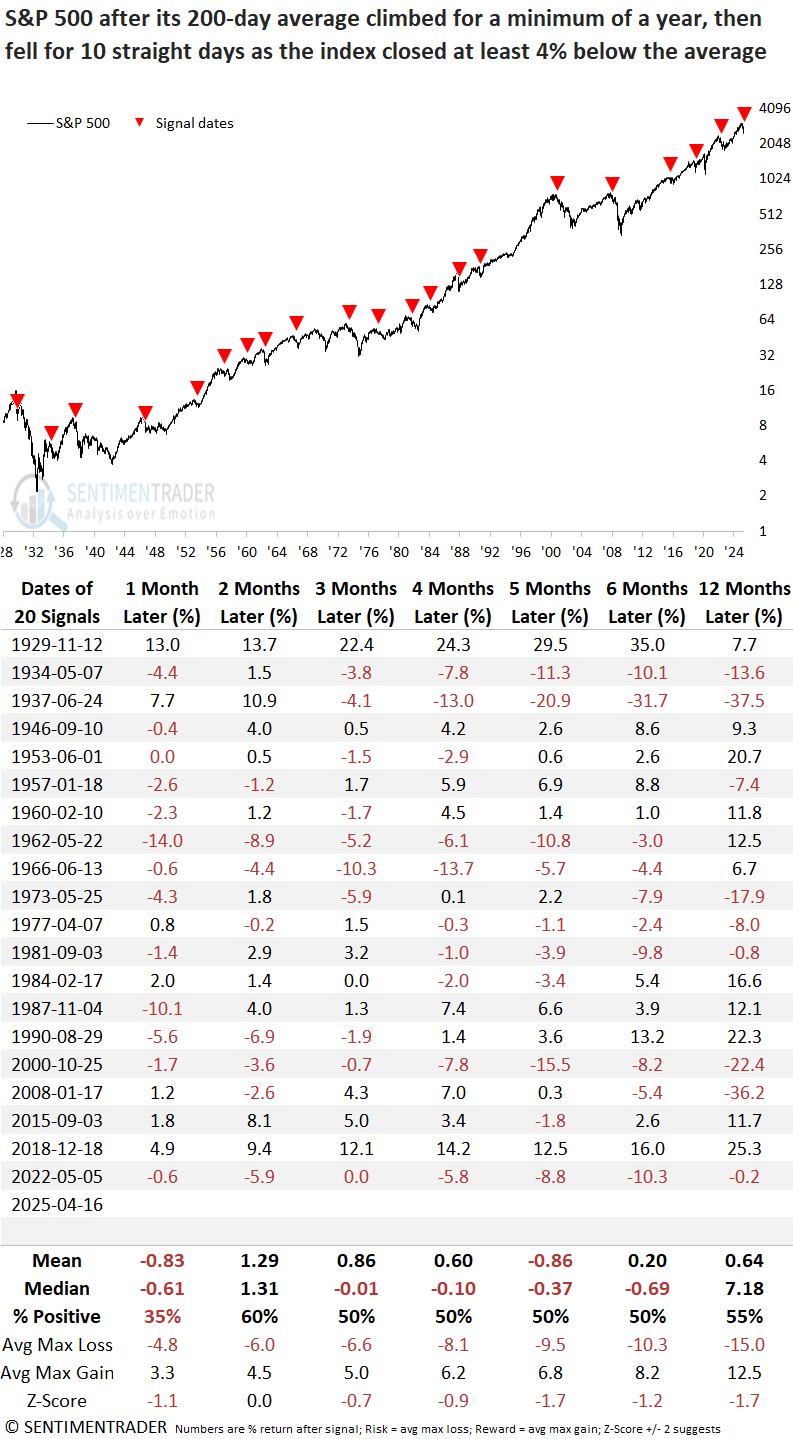
To identify trend shifts resembling current conditions, I implemented a filter requiring the 200-day moving average to have exhibited a positive slope for at least a year before the 10-day decline sequence. This criterion reflects the sentiment and positioning typically seen after a prolonged uptrend, now in the process of being reversed.
Additionally, I included a requirement for the S&P 500 to close 4% or more below its 200-day average, ensuring the signal aligns with significant deviations from the trend, such as now.
Similar trend shifts preceded an uninspiring outlook for stocks
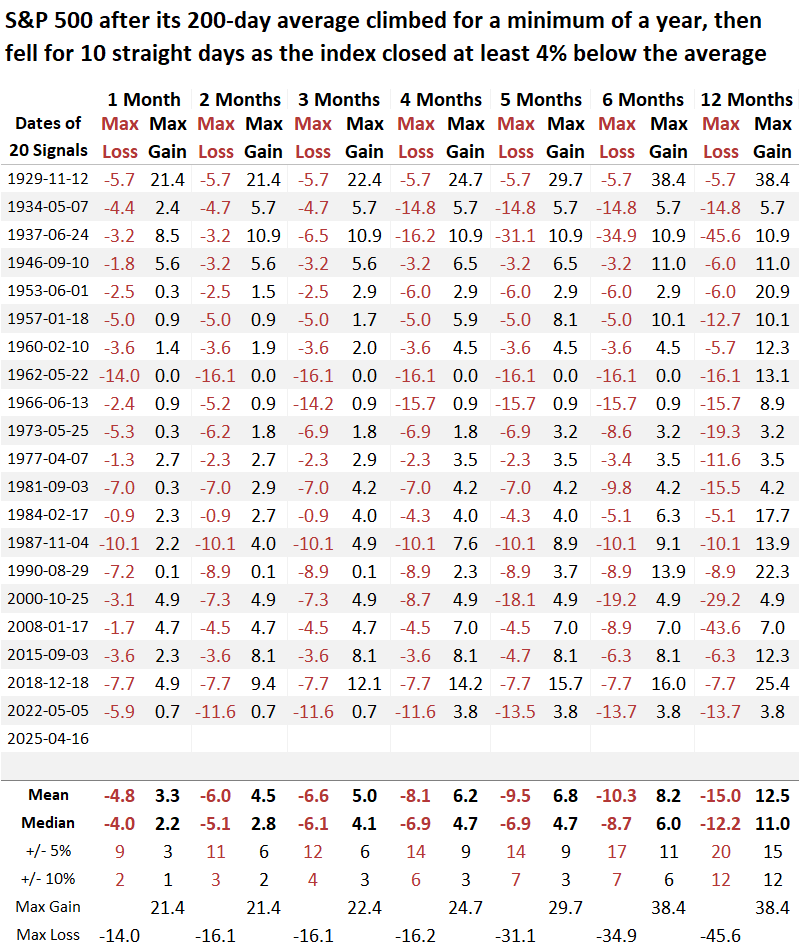
Each time the S&P 500 shifted to a long-term downtrend, its performance over the next year consistently underwhelmed, with returns and win rates that lagged random expectations across all time frames. Furthermore, the average maximum loss surpassed the maximum gain, underscoring a risky environment.
Over the following six months, declines exceeding 5% and 10% occurred more frequently than gains of the same magnitude across all time horizons, signaling a challenging environment.
Over short-term horizons of one to fifteen days, the S&P 500's outlook for the next three weeks appears weak, suggesting that a retest of recent lows remains a distinct possibility.
Out of the 20 previous instances, 13 (or 65%) of trend shift signals occurred within the context of a bear market. The current instance aligns with this scenario, as it was triggered with the S&P 500 down 14% from its high, matching the median decline seen in bear markets.
If this environment is instead a deep correction, history suggests a median additional loss of just 6% from the signal to the low, implying limited downside and a possible retest of the recent lows.
The current backdrop
The weight of the evidence continues to lean bearish, with negative research reports outnumbering positive ones by the most significant margin since the S&P 500 peaked. The data has been updated to include today's note.
Research reports validate or challenge the sustainability of an uptrend or downtrend. As illustrated below, when the spread falls to zero (indicated by the blue arrow), the evidence supporting the uptrend becomes less convincing.
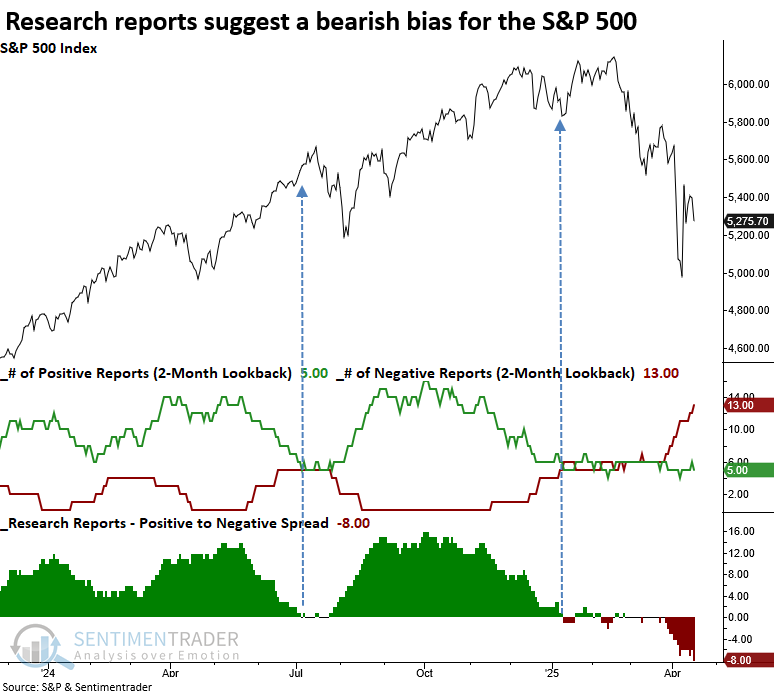
The cumulative indicators are calculated by comparing the returns and consistency for a signal to the study period results over one- to six-month horizons to determine if a report is bullish or bearish. For example, today's signal showed 11 out of 12 metrics as negative compared to the study period, placing this report in the bearish category. The indicators are exclusively based on S&P 500 outcomes.
What the research tells us...
The 200-day moving average for the S&P 500 has now declined for 10 consecutive sessions, signaling a shift in the market's long-term trend. This marks a notable transition from a previously rising 200-day average, suggesting that the underlying momentum supporting the market has weakened considerably. Historically, similar instances of a bearish-to-bullish transition in the slope of the 200-day average, particularly following an extended period of upward movement, have often been precursors to challenging market conditions in the year ahead. In 65% of comparable cases, the S&P 500 was in a bear market.