
A bullish surge in optimism

Key points:
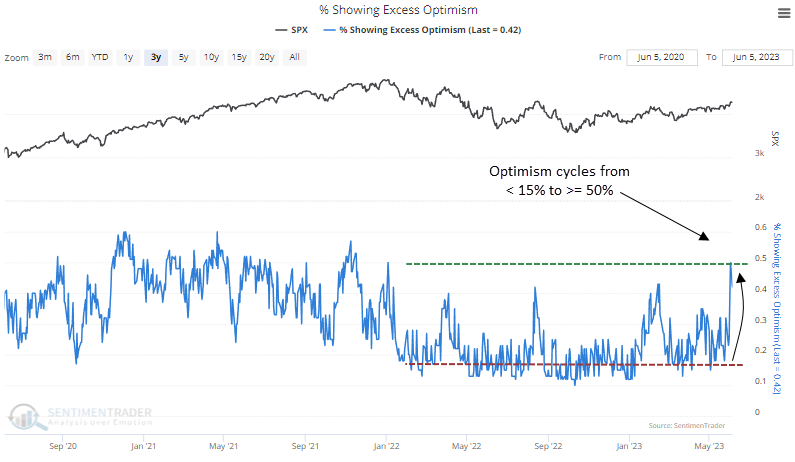
- The percentage of indicators showing excess optimism cycled from less than 15% to 50%
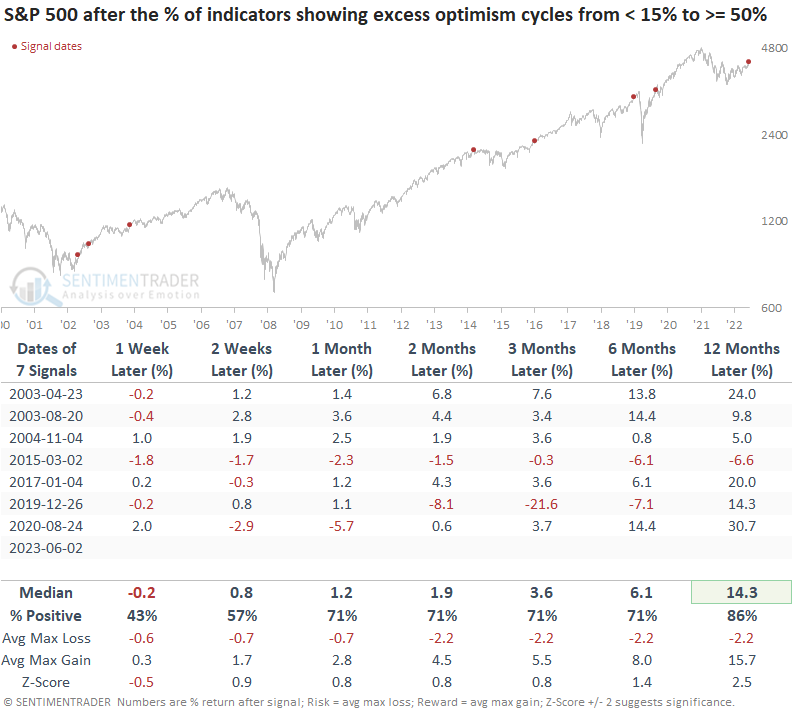
- Similar reversals in optimism preceded an upward bias in the S&P 500 over the next year
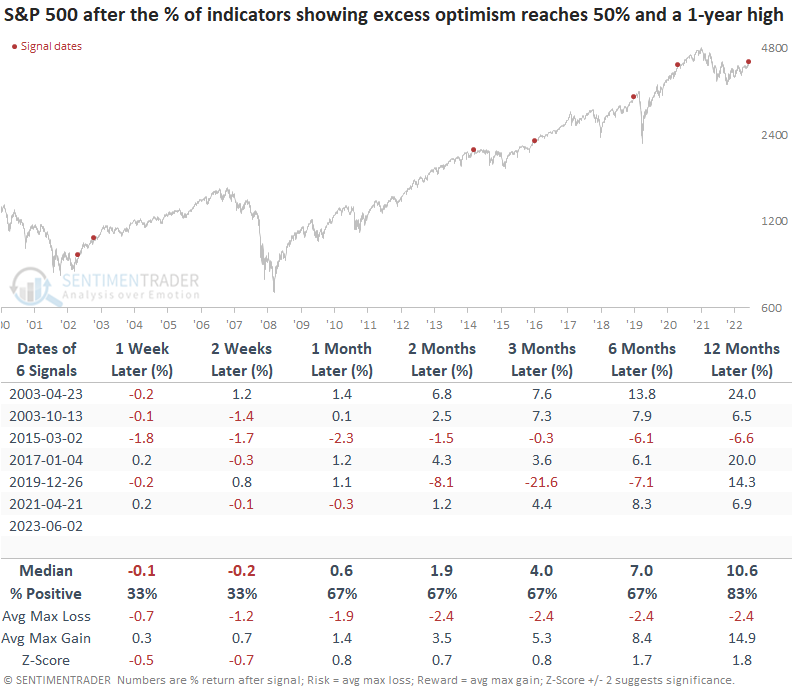
- When excess optimism reaches 50% and a 1-year high, the S&P 500 struggles over the next few weeks
More and more indicators are showing excessive optimism
One of the guiding investment principles I follow is that I never sell the first overbought or optimistic sentiment reading after a market transitions from a downtrend to an uptrend. While excessive optimism can lead to short-term consolidations, when investor behavior shifts upward for the first time in a new uptrend, it's typically more bullish than bearish from a big-picture perspective.
With the percentage of Sentimentrader indicators showing excess optimism, a composite model, surging to 50%, we have our first overbought/optimistic reading in a new uptrend.
Similar reversals in optimism preceded a bullish upward bias
When the percentage of indicators showing excess optimism cycles from less than 15% to 50% or greater, the S&P 500 tends to pause over the next few weeks, with 6 out of 7 precedents showing a negative return at some point. After the lull, the index trended upward over the next year with fairly consistent results.
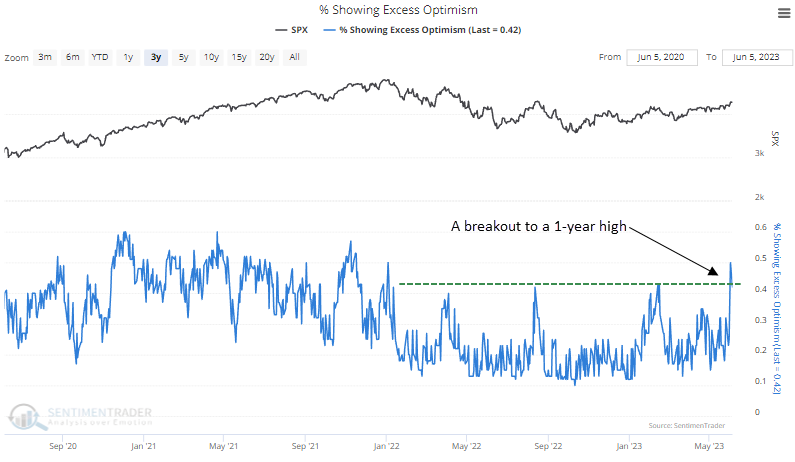
A breakout from a year-long range
The percentage of indicators showing excess optimism closed at the highest level since January 2022, which denotes a change in character for the composite. The model typically ranges from 10% to 40% in bear markets. August 2000 is the only time the indicator exceeded 50% in a significant drawdown period.
Let's assess historical instances when the composite reached 50% and closed at a 1-year high, like now.
The surge in optimism to 50% and a 1-year high suggests the S&P 500 could consolidate its recent gains in the next few weeks. Similar to the first study, the pause tends to refresh a bullish backdrop.
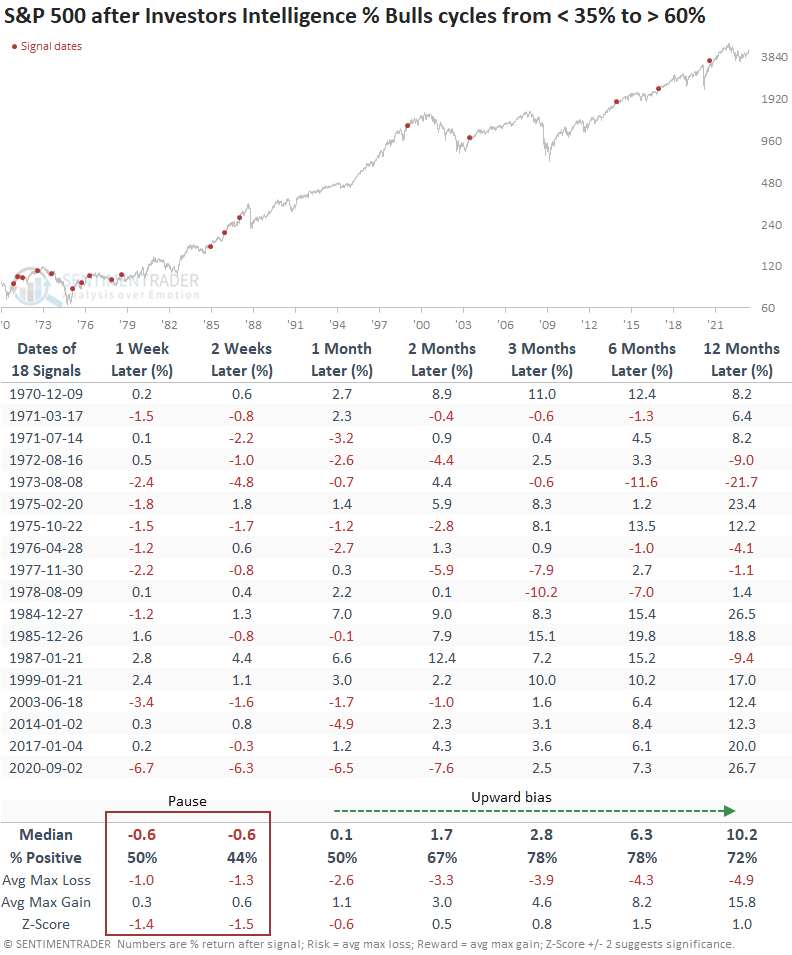
An example of why I don't sell the first sign of optimism in an emerging uptrend
We see a similar outcome when I apply the same concept to the Investors Intelligence % Bulls indicator, which has a 50+ year history. The S&P 500 typically pauses when optimism cycles from bearish to bullish for the first time.
Investors that lost sight of the big picture paid the price. Over the next six months, the S&P 500 showed a gain at some point in every single case.
What the research tells us...
The percentage of indicators showing excess optimism cycled from less than 15% to 50%, indicating a significant change in investor behavior. Usually, you want to fade bullish optimism. However, when sentiment shifts upward near the outset of a new stock market uptrend, a cautious outlook is not advised over a medium and long-term horizon.