A bullish signal from a bearish indicator

Key points
- The Nasdaq 100 has been the unquestioned leader so far in 2023
- The Nasdaq 100 Buying Climaxes indicator is designed to identify exhaustion among buyers
- Like many indicators, there is more than one way to use this indicator
- One iteration of this indicator just gave a signal that has typically been quite favorable in the past
The Nasdaq 100 Buying Climaxes Indicator
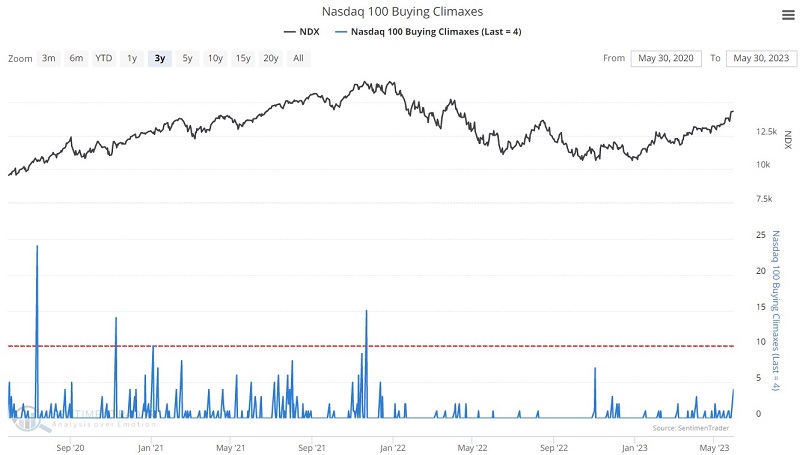
The chart below displays the Nasdaq 100 Buying Climaxes indicator over the past three years.

According to our site:
This chart shows the number of stocks in the Nasdaq 100 that reached a 52-week high during the week and then closed below the prior week's close. It suggests a climax in buying interest among investors, which is a sign of exhaustion. When the number of buying climaxes reaches an extreme, it indicates a large amount of buying exhaustion in the market, likely leading to poor returns in the medium term.
So by definition, this indicator is ostensibly designed to identify an impending period of unfavorable stock market action. But as it turns out, there is more than one way to use this indicator.
A bullish signal from the indicator
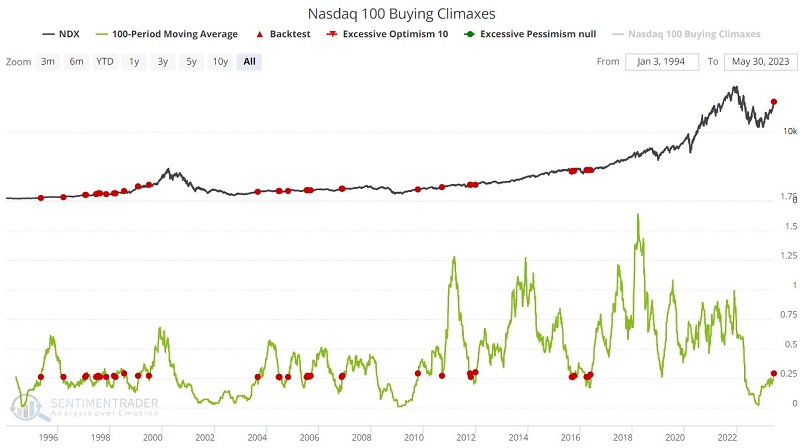
We use a 100-day moving average of daily indicator readings for this test. A bullish reading occurs when the 100-period average crosses above 0.25. In other words, we look for an extended period when there are few buying climaxes (i.e., a 100-day reading below 0.25). When the moving average pops back above 0.25, it indicates a renewed enthusiasm for buying among Nasdaq 100 companies. This type of bullish buying momentum has shown a strong tendency to follow through to the upside ultimately.
The green line in the chart below represents the 100-day moving average of daily Nasdaq 100 Buying Climaxes. The red dots highlight those times when the 100-day moving average crossed above 0.25, and the table summarizes subsequent Nasdaq 100 Index performance.


Note that results for 1-week to 3-months are fairly pedestrian. This should not be too surprising since it takes a lot of persistent buying pressure to generate a signal in the first place - which raises the odds of a near-term pullback. But 6-month and 12-month results are pretty robust, with Win Rates over 90% and strong median returns. The most recent signal just occurred on 2023-05-30.
What the research tells us…
Like many indicators, this particular application of the Nasdaq 100 Buying Climaxes indicator is best used not as a standalone model but as part of a broader weight of the evidence approach. Still, this indicator highlights a common phenomenon in the stock market. Investors become increasingly defensive as a bear market plays out and speculative activity evaporates. Eventually, the market bottoms and turns to the upside. An important clue that the reversal may be real is an increase in speculative activity. This indicator has now given that signal. As always, past performance does not guarantee future results.

