
A bullish long-term trend change for a commodity index

Key points:
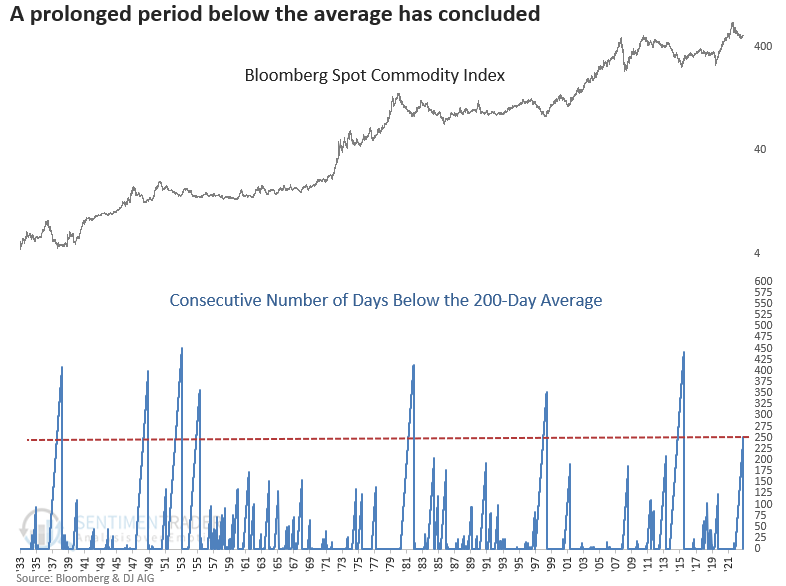
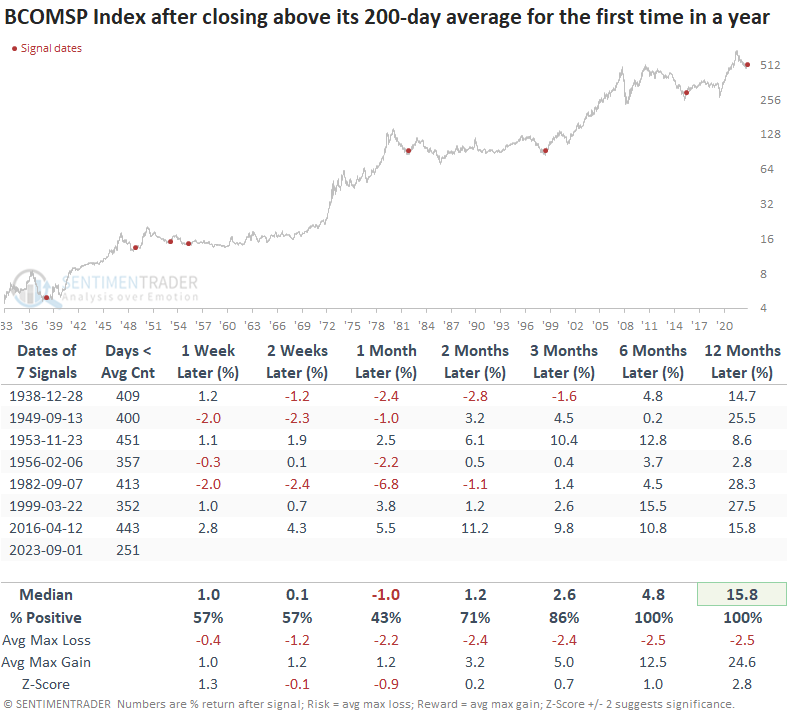
- The Bloomberg Spot Commodity Index closed above its 200-day average for the first time in a year
- Similar trend change signals led to higher commodity prices over the next six and twelve months every time
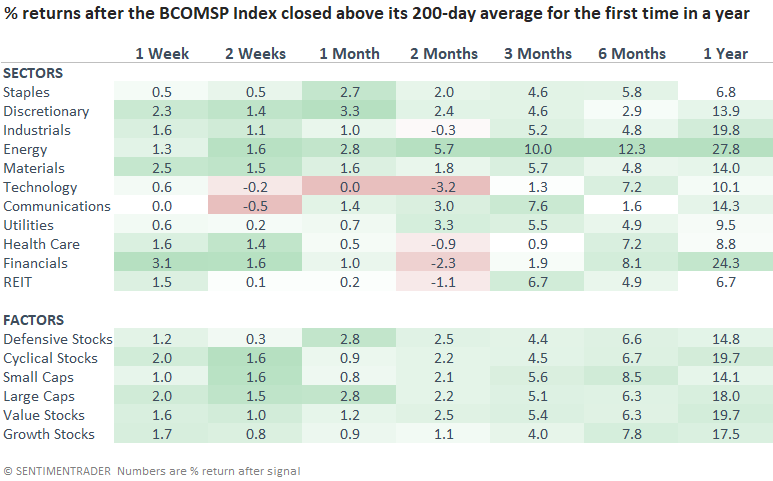
- The energy sector outperforms all other groups over the following year
A commodity index transitions to a long-term uptrend
Commodities, a proxy for global growth, suffered a similar fate to equity indexes, sliding roughly -30% on fears of an economic contraction after central banks increased interest rates at one of the quickest paces in history.
After 251 consecutive trading days below its 200-day moving average, the 8th longest streak in 90 years, the Bloomberg Spot Commodity Index has finally closed above its long-term price trend indicator.
Let's assess the outlook for a broad basket of commodities and stocks after similar trend change signals.
Similar trend changes led to higher commodity prices over the next year
When the Bloomberg Spot Commodity Index broke above its 200-day moving average for the first time in more than a year, a diverse basket of commodities exhibited lackluster returns in the ensuing months. Nevertheless, this initial lull eventually paved the way for a sustained uptrend, with the index registering a gain 100% of the time over the subsequent six and twelve-month horizons.
By reducing the threshold to 175 trading days below the 200-day average, we can generate six additional precedents. A year later, the Bloomberg Spot Commodity Index was higher 85% of the time, with a median gain of 14.7%.
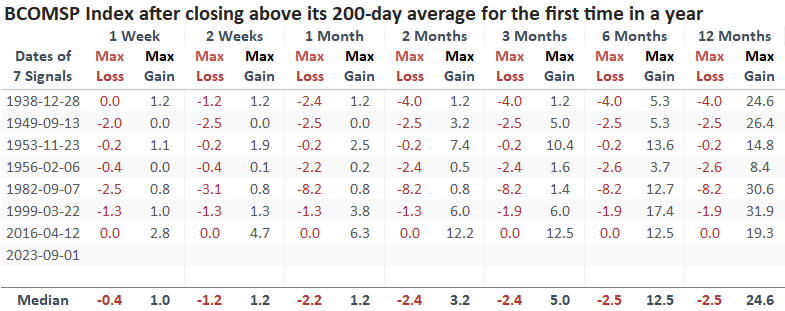
Following similar trend change shifts, drawdowns remained subdued, with the most significant loss within the subsequent year reaching just -8.2%.
Energy, a sector showing renewed strength after consolidating for the last year, is the clear-cut winner after the Bloomberg Spot Commodity Index shifts to a new uptrend like now.
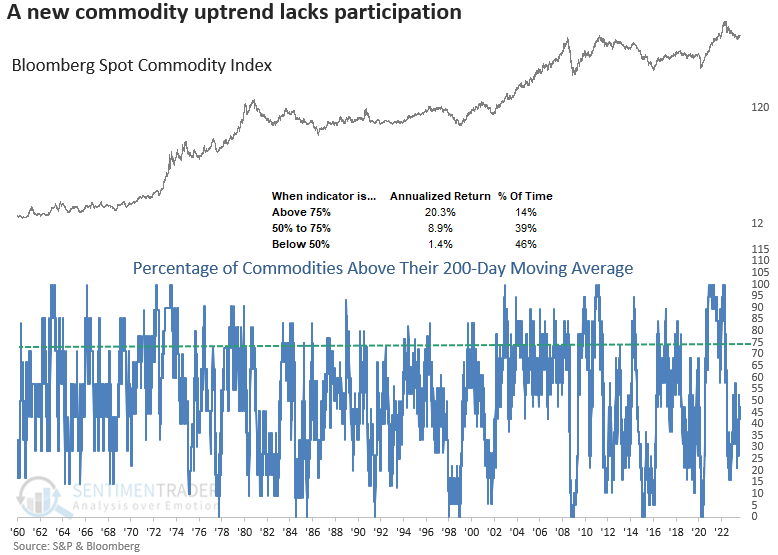
An increase in participation from other commodities would bolster the case for a new uptrend
While there has been a trend change at the index level, it's important to note that broad participation is uninspiring, with fewer than 50% of commodities above their respective 200-day averages. Historically, the Bloomberg Spot Commodity Index delivers robust returns when over 75% of commodities are trading above their long-term averages.
Do commodity downtrends foreshadow recessions?
The last time an extended period below the 200-day average was associated with a recession was in 1982. So, should we be using commodities as a proxy for economic contractions?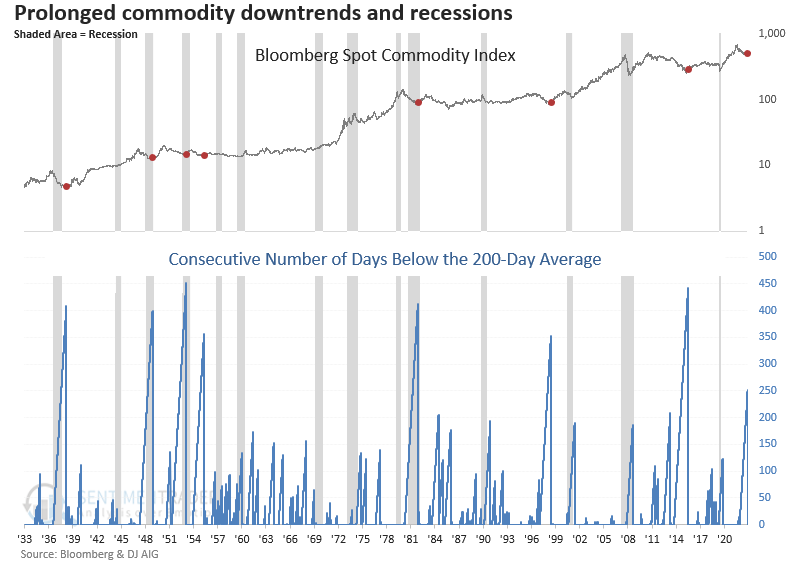
In light of the unfavorable shift in commodity seasonality, as outlined by my colleague Jay Kaeppel in a recent research report, the uninspiring price action expected in the coming months following the trend change signal may offer an entry opportunity for an ETF like GSG.
What the research tells us...
The Bloomberg Spot Commodity Index closed above its 200-day average for the first time in a year. After similar trend change signals, the index rallied 100% of the time over the subsequent six and twelve-month periods. Even when I reduced the threshold to less than nine months, the commodity basket was higher 85% of the time over the following year, with a robust gain of 14.7%. With the last prolonged period below the average associated with a recession occurring in 1982, one has to wonder how much emphasis one should place on commodities as a harbinger of economic contractions.