Products
SentimenTrader Trading Tools
‍
Backtest Engine
My Trading Toolkit
Correlation Analysis
Seasonality
Indicators & Data API
‍
Proprietary Indicators & Charts
Market Data API
Strategies & Scanner
‍
50+ Trading Strategies
Smart Stock Scanner
Research Reports
‍
Research Solutions
Reports Library
Free Resources
Simple Backtest Calculator
Simple Seasonality Calculator
The Kelly Criterion Calculator
Sentiment Geo Map
Public Research Reports
Pricing
Company
About
In the News
Testimonials
Client Success Stories
Contact
Log inLoginSign up
< BACK TO ALL REPORTS

A bullish breakout for the world's most-watched benchmark

Dean Christians
2023-05-19
For only the 29th time in more than 90 years, the S&P 500 closed at an 8-month high but not a 12-month high. After similar breakouts, the S&P 500 was higher 86% of the time a year later, with 17 consecutive winners since 1958.

Key points:

  • The S&P 500 closed at an 8-month high but not a 12-month high
  • Similar breakouts preceded bullish uptrends with solid returns, win rates, and z-scores 

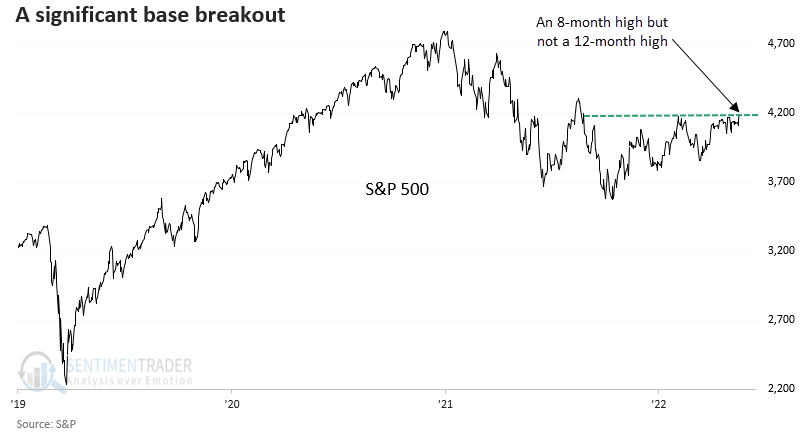
Rangebound markets eventually resolve themselves one way or another

According to a base breakout pattern triggered on Thursday, the odds of an upside resolution to the almost year-long consolidation in the S&P 500 Index look excellent. 

For only the 29th time since 1932, the S&P 500 closed at an 8-month high but not a 12-month high. The previous breakout occurred in 2016, which eventually led to a steady uptrend in 2017. 

Similar base breakouts suggest a new uptrend for the S&P 500 

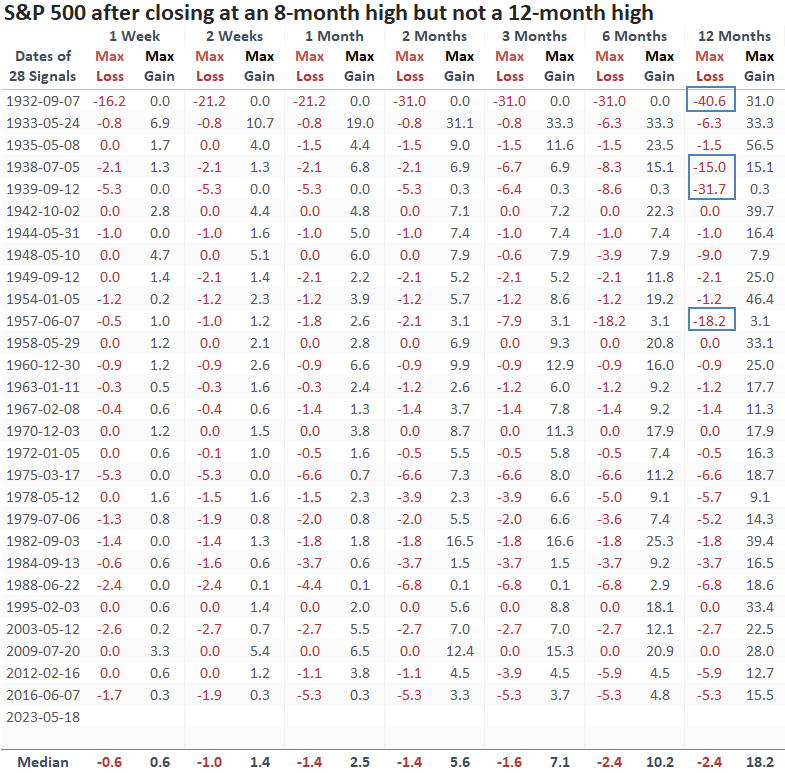
When the S&P 500 reaches an 8-month high but remains below a 12-month high, returns, win rates, and z-scores for the world's most-watched benchmark look excellent. A year later, the S&P 500 was higher 86% of the time, with 17 consecutive winners since 1958.

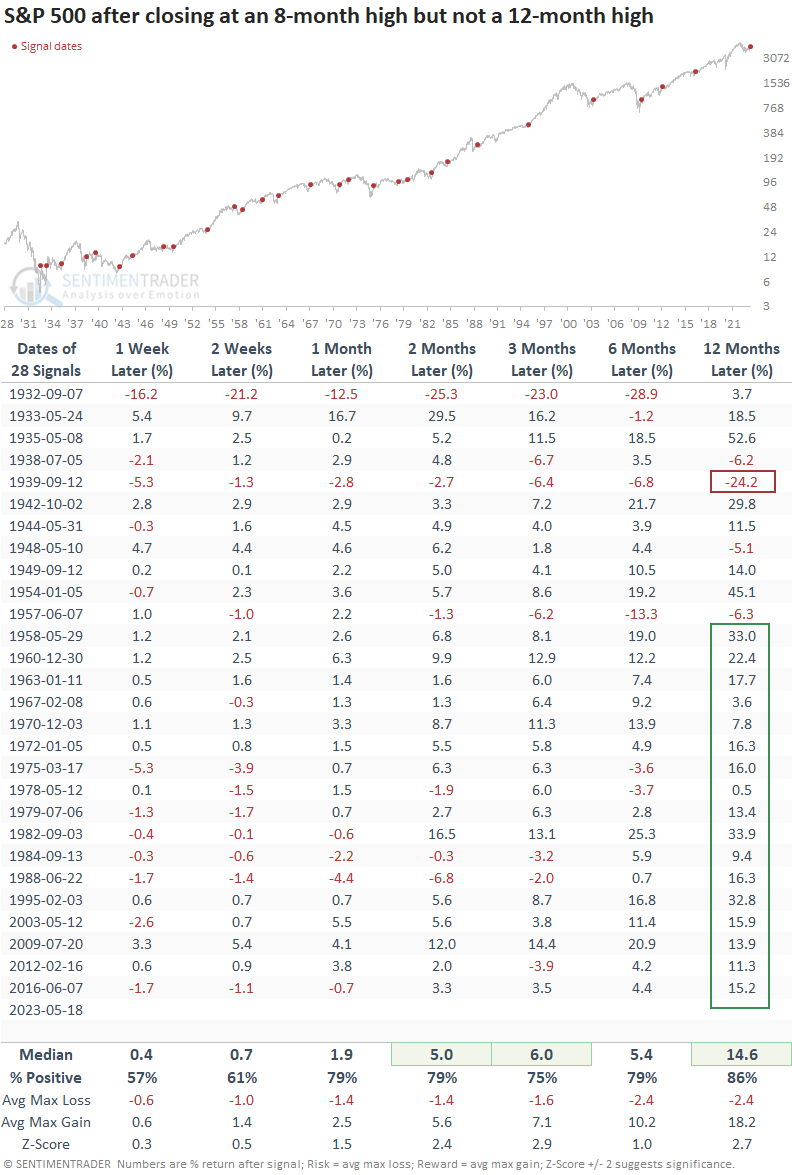
Only four precedents showed a max loss more significant than -10% a year later, which all occurred before 1958.

Where should we be looking for opportunities 

Market internals for groups within the S&P 500 lean bullish in growth-oriented sectors like Technology. On Thursday, the percentage of 12-month highs in Technology reached the highest level in more than a year. 
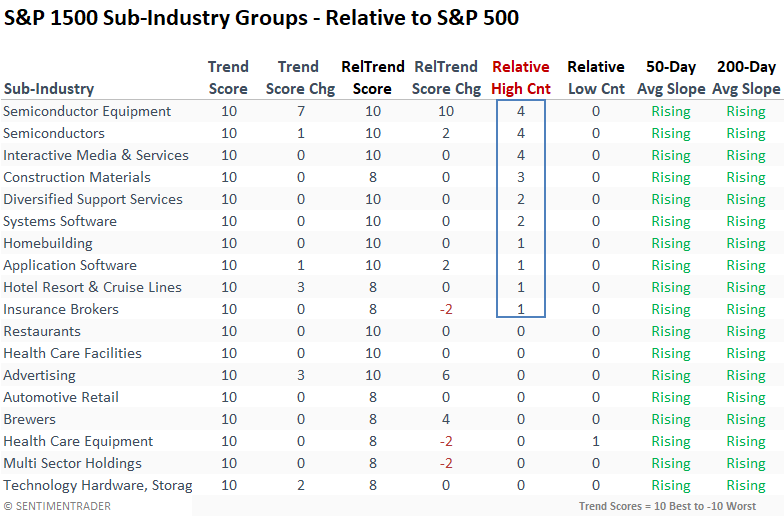
Relative Strength

Communication Services and Technology maintain perfect absolute and relative trend scores versus the S&P 500. And in the last five trading sessions, both groups registered four or more new relative highs. 

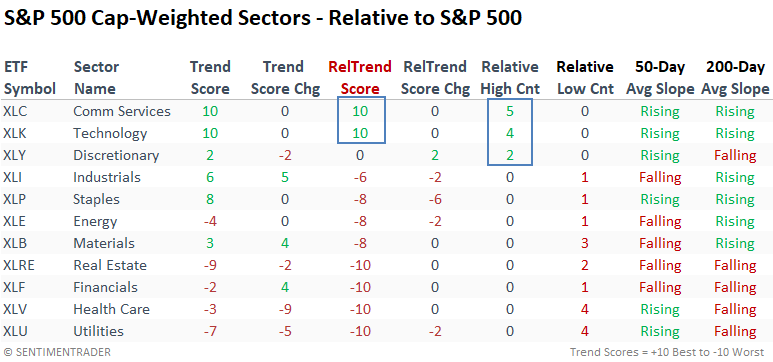
When I drill down to sub-industries, groups within Technology and Consumer Discretionary dominate the relative trend score rankings. And semiconductors are breaking out on an absolute and relative basis. 

What the research tells us...

The weight of the evidence continues to suggest an upside resolution to the almost year-long consolidation. The most recent bullish development for the S&P 500 is a new 8-month high without a 12-month high. Historically, long-duration base breakouts like this have led to new uptrends for the world's most-watched benchmark. From a positioning perspective, growth-oriented groups continue to offer the best opportunity for outperformance.

Sorry, you don't have access to this report

Upgrade your subscription plan to get access
Go to Dasboard
PRODUCTS
SentimenTrader
Trading Tools
Indicators & Data API
‍
Strategies & Scanner
‍
Research Reports
FREE
RESOUrCES
Simple Backtest
Calculator
Simple Seasonality
Calculator
The Kelly Criterion
Calculator
Sentiment Geo Map
‍
Public Research Reports
‍
Pricing
Bundle pricing
‍
Announcements
‍
FAQ
COMPANY
‍
About
‍
In the News
‍
Testimonials
‍
Client Success Stories
CONTACT
‍
General Inquiries
‍
Media Inquiries
‍
Financial Professionals Inquiries
‍
© 2025 Sundial Capital Research Inc. All rights reserved.
Setsail Marketing
TermsPrivacyAffiliate Program
Risk Disclosure: Futures and forex trading contains substantial risk and is not for every investor. An investor could potentially lose all or more than the initial investment. Risk capital is money that can be lost without jeopardizing ones’ financial security or life style. Only risk capital should be used for trading and only those with sufficient risk capital should consider trading. Past performance is not necessarily indicative of future results.

Hypothetical Performance Disclosure: Hypothetical performance results have many inherent limitations, some of which are described below. No representation is being made that any account will or is likely to achieve profits or losses similar to those shown; in fact, there are frequently sharp differences between hypothetical performance results and the actual results subsequently achieved by any particular trading program. One of the limitations of hypothetical performance results is that they are generally prepared with the benefit of hindsight. In addition, hypothetical trading does not involve financial risk, and no hypothetical trading record can completely account for the impact of financial risk of actual trading. for example, the ability to withstand losses or to adhere to a particular trading program in spite of trading losses are material points which can also adversely affect actual trading results. There are numerous other factors related to the markets in general or to the implementation of any specific trading program which cannot be fully accounted for in the preparation of hypothetical performance results and all which can adversely affect trading results.

Testimonial Disclosure: Testimonials appearing on this website may not be representative of other clients or customers and is not a guarantee of future performance or success.