Products
SentimenTrader Trading Tools
‍
Backtest Engine
My Trading Toolkit
Correlation Analysis
Seasonality
Market Prediction
Indicators & Data API
‍
Proprietary Indicators & Charts
Market Data API
Strategies & Scanner
‍
50+ Trading Strategies
Smart Stock Scanner
Smart Option Scanner
Research Reports
‍
Research Solutions
Reports Library
Free Resources
Simple Backtest Calculator
Simple Seasonality Calculator
The Kelly Criterion Calculator
Sentiment Geo Map
Public Research Reports
Education
Sentiment Indicators
Technical Indicators
Pricing
Company
About
In the News
Testimonials
Client Success Stories
Contact
Log inLoginSign up
< BACK TO ALL REPORTS

A bullish base breakout for a small-cap index

Dean Christians
2023-12-18
For only the 26th time since 1932, the Russell 2000 Total Return Index closed at a 1-year high but not a 2-year high, completing a base breakout pattern. Similar breakouts led to bullish outcomes for small-cap stocks and the broad market over the subsequent year.

Key points:

  • Small caps closed at a 1-year high but not a 2-year high, completing a base breakout 
  • Similar patterns led to a consistent upward bias in the small-cap index over the subsequent year
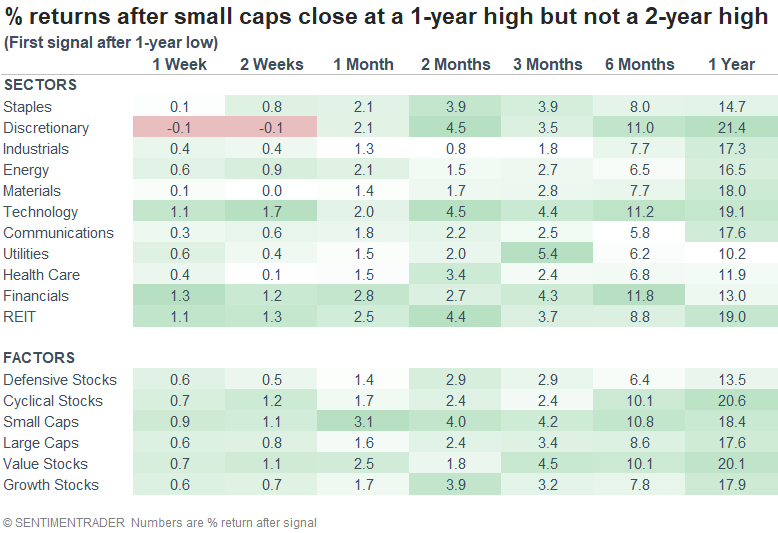
  • Outperformance across sectors and factors tilted more toward offensive rather than defensive groups

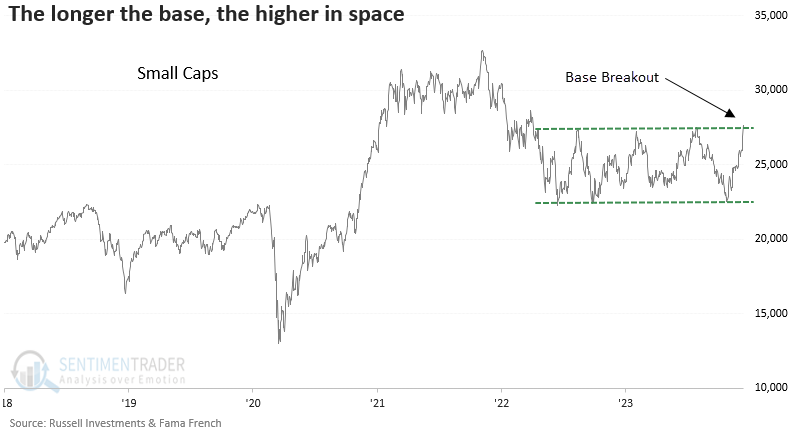
An index containing economically sensitive small stocks breaks out to a new high

The Federal Open Market Committee (FOMC) opted to maintain the target rate at its current level for the third consecutive meeting last week. It also hinted at the potential for rate cuts in 2024. This decision sent economically sensitive small-cap stocks surging higher, triggering a substantial expansion in new highs amongst index components.

With numerous small-cap stocks registering one-, three-, and twelve-month highs last week, the bullish price action from individual stocks contributed to a new 1-year high in the Russell 2000 Total Return Index. 

For only the 26th time since 1932, the small-cap index closed at a 1-year high but not a 2-year high, completing a base breakout pattern after recording a 1-year low as recently as October.

Similar base breakouts preceded further gains

Small caps show a consistent upward bias over all time horizons whenever the index reaches a 1-year high but remains below a 2-year high.

While the previous signal failed miserably, 63-day highs for index components were only 22% compared to the 48% reading from last week. So, significantly more stocks are participating in the upside price action on this breakout.

Since the 1929-49 secular bear market, the small-cap index was higher a year later in 16 out of 18 precedents.

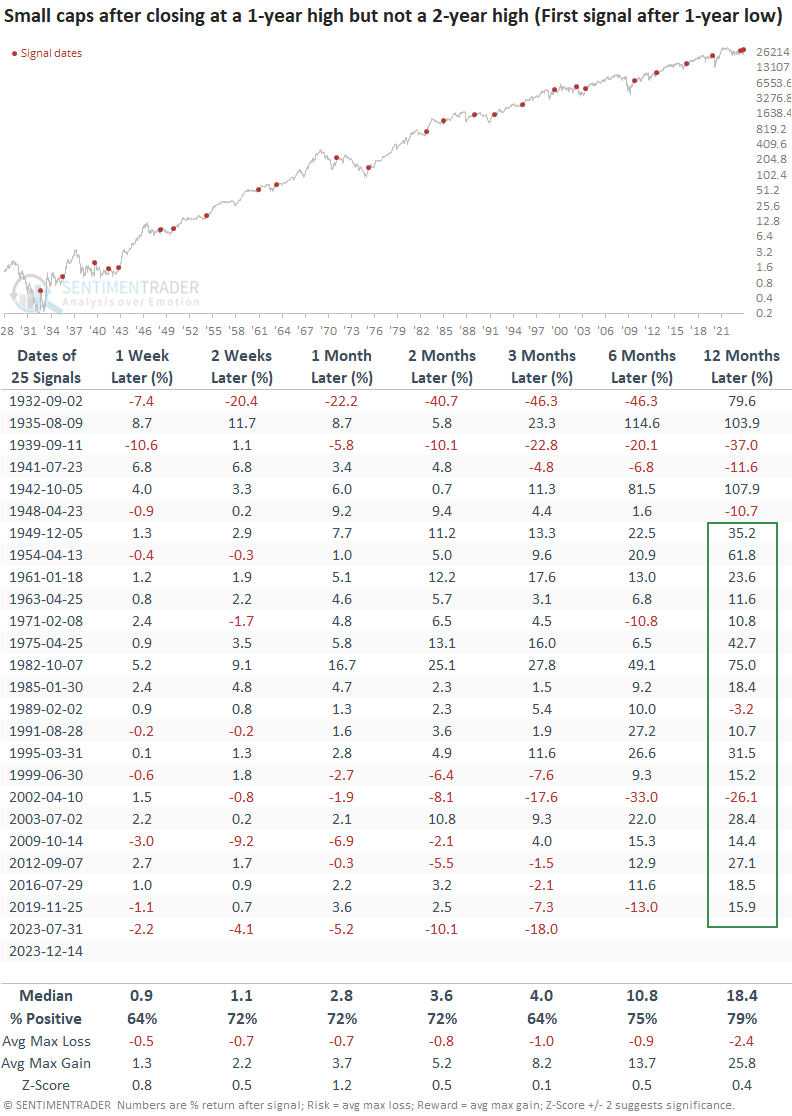
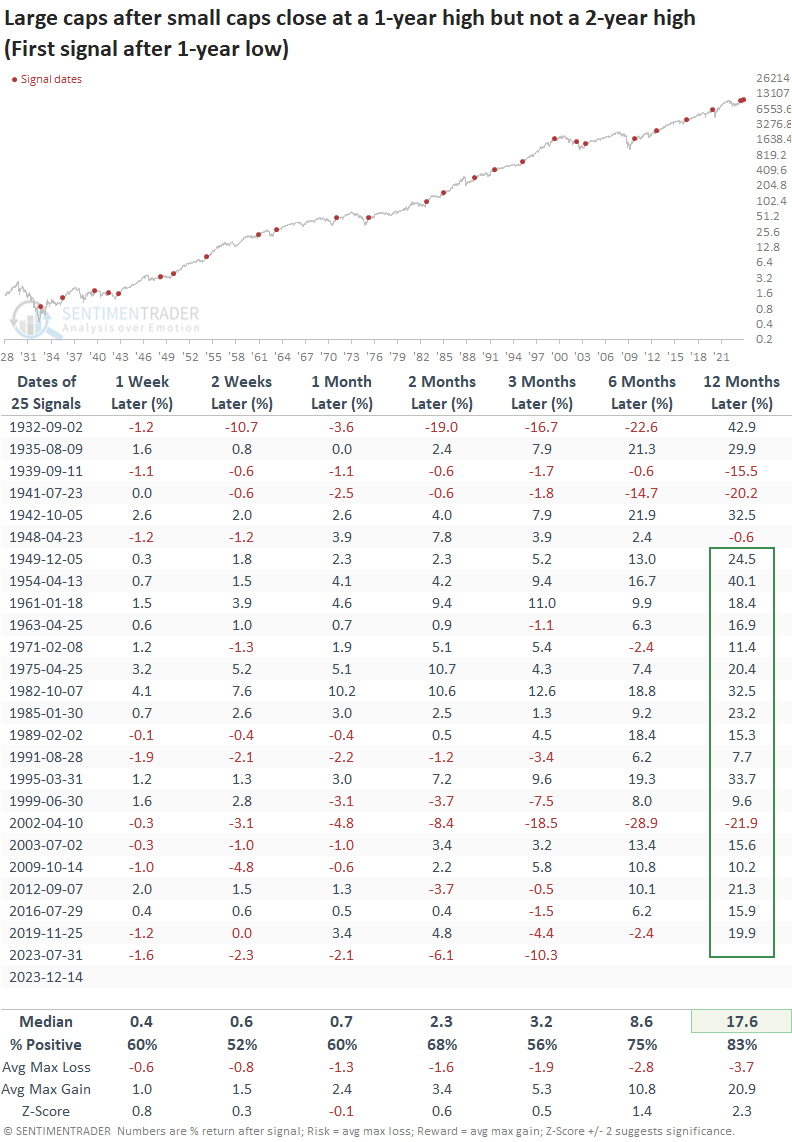
What about large caps?

What works well for small-cap stocks tends to be advantageous for large-cap stocks, too. Over the following year, the large-cap index was up 83% of the time, slightly edging out the 79% win rate for small caps. 

Small caps outperformed their large-cap counterparts in every time horizon examined. As one might anticipate, the breakout in an economically sensitive small-cap index was accompanied by more robust performance in offensive sectors and factors. 

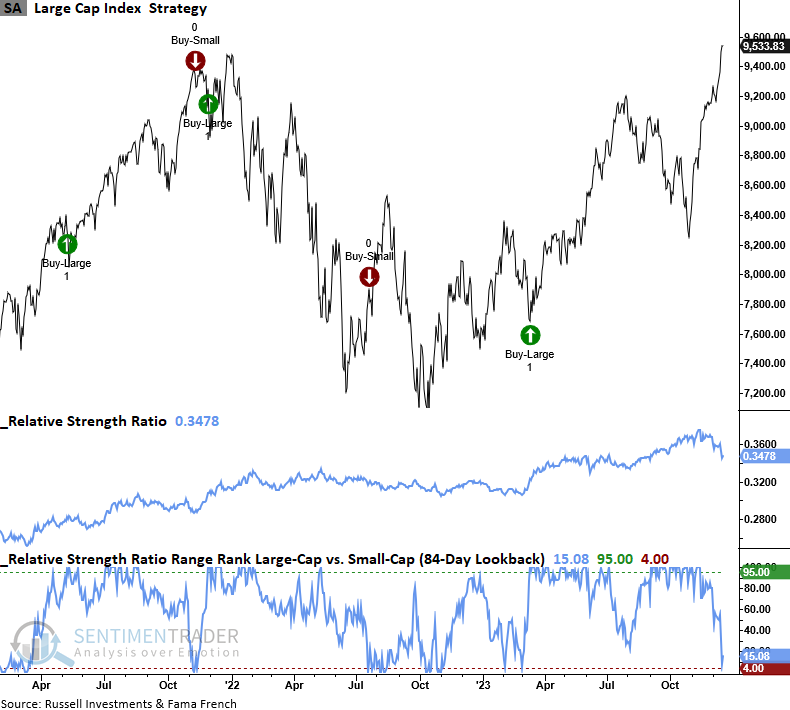
Relative Ratio Range Rank Model

While the small-cap index broke out and has outperformed large-caps since the second week in November, the bullish price action has not been enough to trigger a shift from large to small, according to my relative ratio range rank system. However, it's close.

What the research tells us...

Just about any way you look at the price action, whether from internal or external measures, the price action in small-cap stocks is bullish. The 1-year base breakout in the Russell 2000 Total Return Index has historically led to higher prices over the following year. Perhaps the most prevalent argument against investing in small caps revolves around the general sentiment surrounding this category. Let's face it - when was the last time you went to a party and someone was talking about buying a small-cap bank instead of the latest and greatest Technology stock driving the AI revolution? History suggests we should keep small-cap stocks on our radar screen. Still, it's imperative to use relative strength indicators for timing and risk management.

PRODUCTS
SentimenTrader
Trading Tools
Indicators & Data API
‍
Strategies & Scanner
‍
Research Reports
FREE
RESOUrCES
Simple Backtest
Calculator
Simple Seasonality
Calculator
The Kelly Criterion
Calculator
Sentiment Geo Map
‍
Public Research Reports
‍
Education
Sentiment Indicators
‍
Technical Indicators
‍
Pricing
Bundle pricing
‍
FAQ
‍
Announcements
‍
COMPANY
‍
About
‍
In the News
‍
Testimonials
‍
Client Success Stories
CONTACT
‍
General Inquiries
‍
Media Inquiries
‍
Financial Professionals Inquiries
‍
© 2026 Sundial Capital Research Inc. All rights reserved.
Setsail Marketing
TermsPrivacyAffiliate Program
Risk Disclosure: The information and tools provided are for research and analytical purposes only and are not intended as investment advice. Market analysis involves uncertainty, and outcomes may differ from expectations. Users should conduct their own due diligence and consider their individual circumstances before making any financial decisions. Past performance is not necessarily indicative of future results.

Hypothetical Performance Disclosure: Hypothetical performance results have many inherent limitations, some of which are described below. No representation is being made that any account will or is likely to achieve profits or losses similar to those shown; in fact, there are frequently sharp differences between hypothetical performance results and the actual results subsequently achieved by any particular trading program. One of the limitations of hypothetical performance results is that they are generally prepared with the benefit of hindsight. In addition, hypothetical trading does not involve financial risk, and no hypothetical trading record can completely account for the impact of financial risk of actual trading. for example, the ability to withstand losses or to adhere to a particular trading program in spite of trading losses are material points which can also adversely affect actual trading results. There are numerous other factors related to the markets in general or to the implementation of any specific trading program which cannot be fully accounted for in the preparation of hypothetical performance results and all which can adversely affect trading results.

Testimonial Disclosure: Testimonials appearing on this website may not be representative of other clients or customers and is not a guarantee of future performance or success.