Products
SentimenTrader Trading Tools
‍
Backtest Engine
My Trading Toolkit
Correlation Analysis
Seasonality
Indicators & Data API
‍
Proprietary Indicators & Charts
Market Data API
Strategies & Scanner
‍
50+ Trading Strategies
Smart Stock Scanner
Research Reports
‍
Research Solutions
Reports Library
Free Resources
Simple Backtest Calculator
Simple Seasonality Calculator
The Kelly Criterion Calculator
Sentiment Geo Map
Public Research Reports
Education
Sentiment Indicators
Technical Indicators
Pricing
Company
About
In the News
Testimonials
Client Success Stories
Contact
Log inLoginSign up
< BACK TO ALL REPORTS

A bullish backdrop for the Nasdaq 100

Dean Christians
2023-04-04
Several price momentum and breadth-based indicators triggered bullish signals for the Nasdaq 100. After similar precedents, one of the world's most popular trading vehicles closed higher a year later every time.

Key points:

  • The Nasdaq 100 triggered a bullish long-term price momentum signal
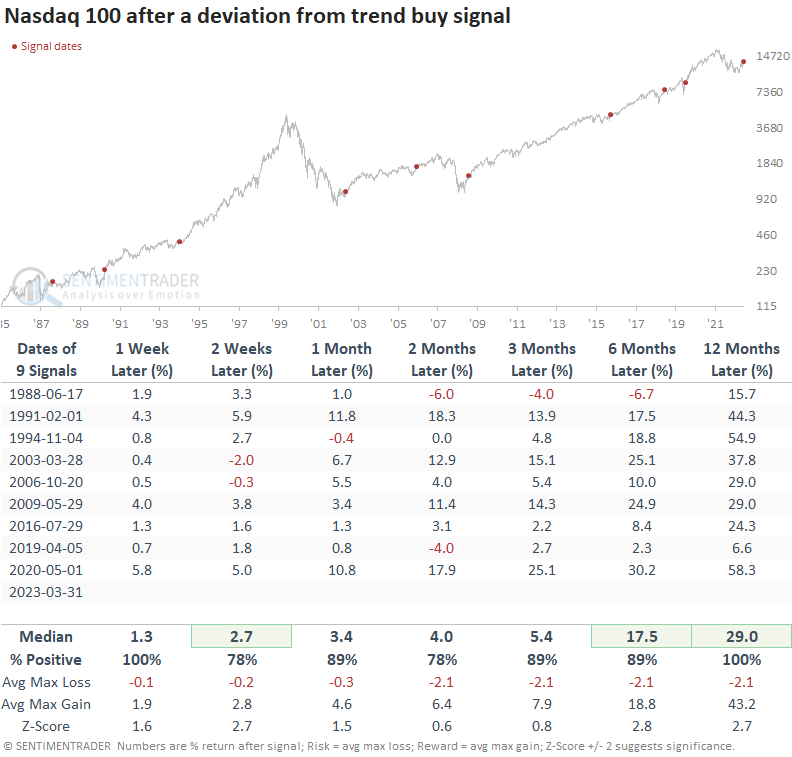
  • After similar signals, the NDX 100 was higher 100% of the time a year later
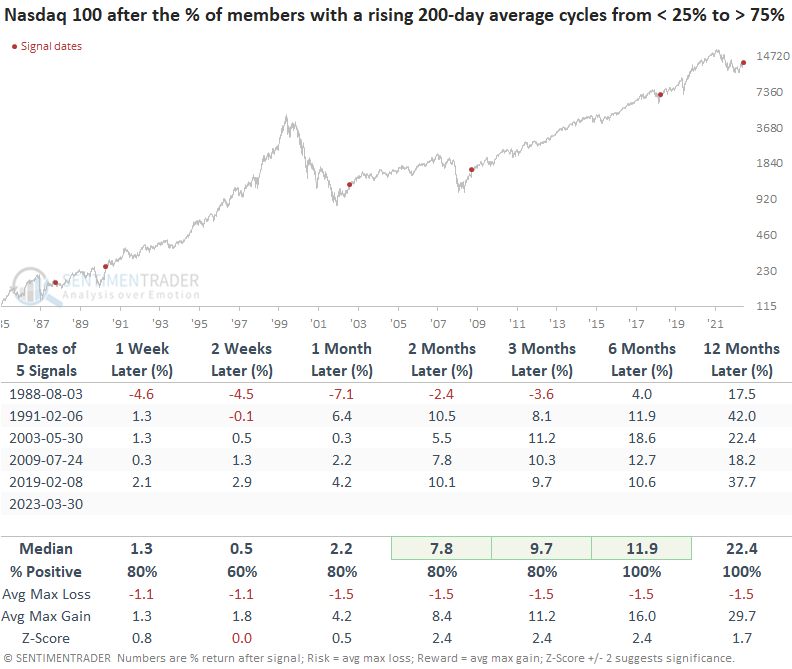
  • The percentage of Nasdaq 100 members with a rising 200-day average cycled from < 25% to > 75%
  • When NDX members cycle from downtrends to uptrends, the index is higher a year later every time

External and internal price trends for the NDX 100 turn favorable

The Nasdaq 100, which one can trade via the QQQ ETF, is one of the more popular indices in the world, especially in recent years, as a handful of mega-cap Technology stocks dominate the index weightings.

For only the 10th time since 1985, the Nasdaq 100 registered a deviation from trend buy signal. The system measures the 4-week moving average for the index relative to the 40-week average. An alert occurs when the ratio between the two averages cycles from less than 0.93 to greater than 1.04.

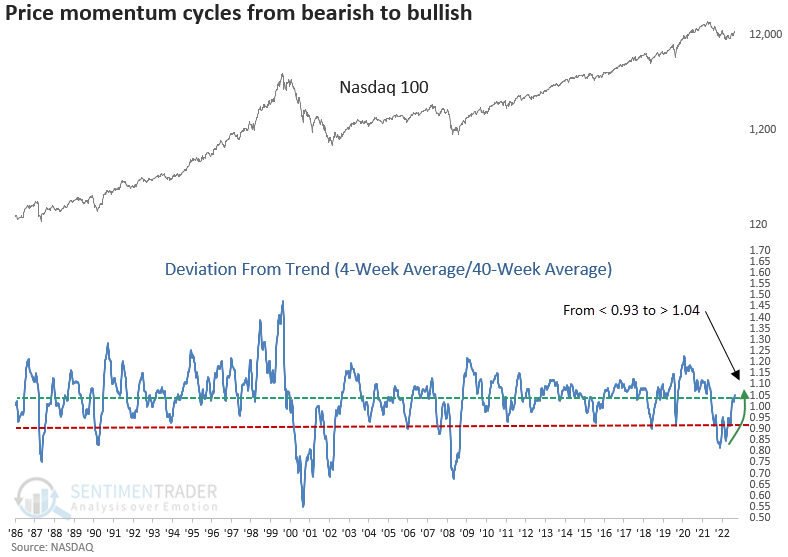
I highlighted a buy signal for the equal-weighted Technology sector in February using the deviation from trend concept.

Similar reversals preceded positive returns for the Nasdaq 100

When the ratio between the short and medium-term moving average for the Nasdaq 100 cycles from < 0.93 to > 1.04, the NDX 100 shows excellent results across all time frames, especially a year later. And drawdowns were remarkedly low in the first three months with a median loss of -2.1% and a max loss of -8.5%.

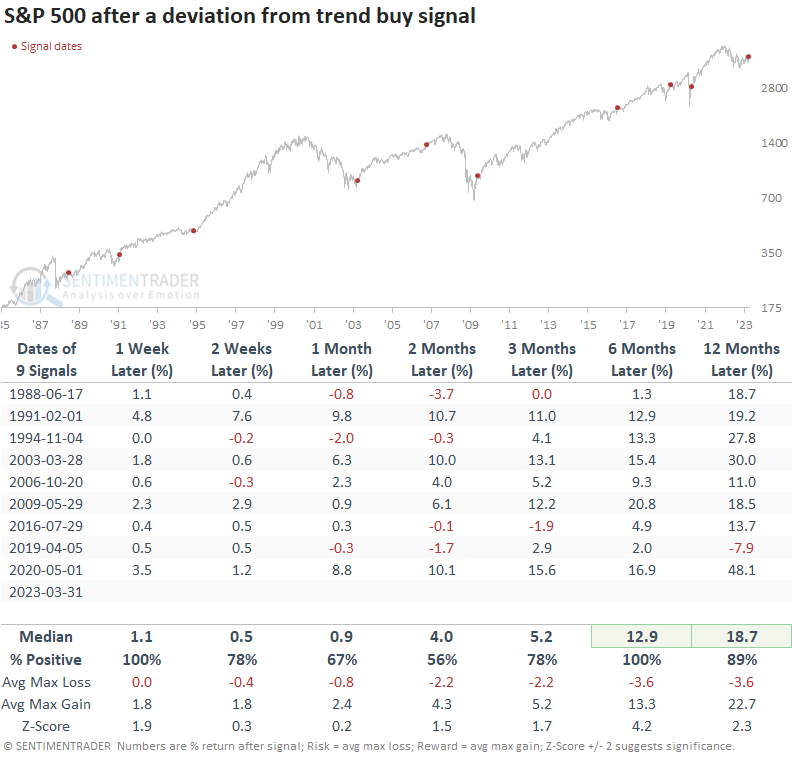
When I apply the Nasdaq 100 signals to the S&P 500, the results look equally impressive on a long-term basis. 

Most Nasdaq 100 members are in long-term uptrends

With so much buzz about how a handful of mega-cap stocks are driving the positive performance for capitalization-weighted indexes this year, it's interesting to see most Nasdaq 100 members maintain a rising 200-day average, similar to what I showed last week for the S&P 500 Technology sector. 

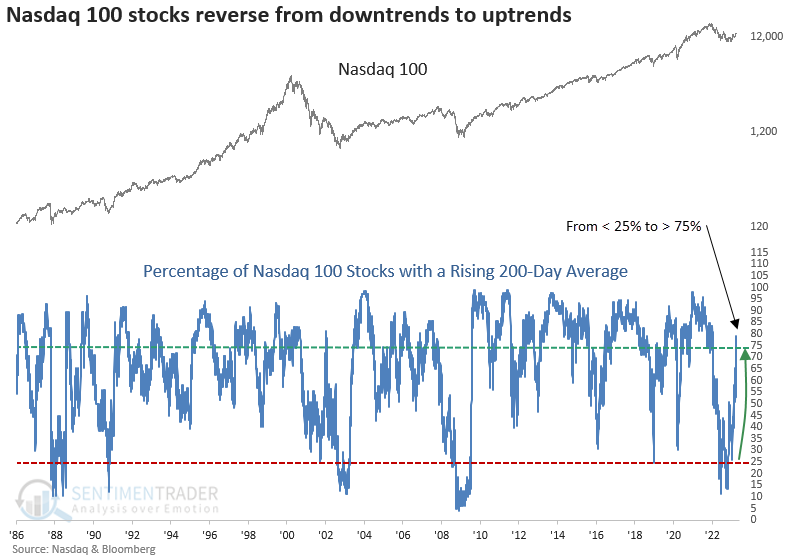
When the percentage of Nasdaq 100 stocks with a rising 200-day average cycle from < 25% to > 75%, the index showed a consistent upward bias across most time horizons, with excellent long-term results. While the sample size is small, once again, drawdowns were minimal.

What the research tells us...

Price momentum at the index level and long-term trends for index members turned favorable for the Nasdaq 100. After similar precedents, the NDX 100 was higher a year later every time, with reasonably benign drawdowns. Remember, in long-term uptrends, we want to buy oversold conditions or identify stocks in a consolidation where we can define our risk/reward for a trade setup.

Sorry, you don't have access to this report

Upgrade your subscription plan to get access
Go to Dasboard
PRODUCTS
SentimenTrader
Trading Tools
Indicators & Data API
‍
Strategies & Scanner
‍
Research Reports
FREE
RESOUrCES
Simple Backtest
Calculator
Simple Seasonality
Calculator
The Kelly Criterion
Calculator
Sentiment Geo Map
‍
Public Research Reports
‍
Education
Sentiment Indicators
‍
Technical Indicators
‍
Pricing
Bundle pricing
‍
FAQ
‍
Announcements
‍
COMPANY
‍
About
‍
In the News
‍
Testimonials
‍
Client Success Stories
CONTACT
‍
General Inquiries
‍
Media Inquiries
‍
Financial Professionals Inquiries
‍
© 2026 Sundial Capital Research Inc. All rights reserved.
Setsail Marketing
TermsPrivacyAffiliate Program
Risk Disclosure: Futures and forex trading contains substantial risk and is not for every investor. An investor could potentially lose all or more than the initial investment. Risk capital is money that can be lost without jeopardizing ones’ financial security or life style. Only risk capital should be used for trading and only those with sufficient risk capital should consider trading. Past performance is not necessarily indicative of future results.

Hypothetical Performance Disclosure: Hypothetical performance results have many inherent limitations, some of which are described below. No representation is being made that any account will or is likely to achieve profits or losses similar to those shown; in fact, there are frequently sharp differences between hypothetical performance results and the actual results subsequently achieved by any particular trading program. One of the limitations of hypothetical performance results is that they are generally prepared with the benefit of hindsight. In addition, hypothetical trading does not involve financial risk, and no hypothetical trading record can completely account for the impact of financial risk of actual trading. for example, the ability to withstand losses or to adhere to a particular trading program in spite of trading losses are material points which can also adversely affect actual trading results. There are numerous other factors related to the markets in general or to the implementation of any specific trading program which cannot be fully accounted for in the preparation of hypothetical performance results and all which can adversely affect trading results.

Testimonial Disclosure: Testimonials appearing on this website may not be representative of other clients or customers and is not a guarantee of future performance or success.