Data &
Technology
Research
Reports
Report Solutions
Reports Library
Actionable
Strategies
Free
Resources
Simple Backtest Calculator
Simple Seasonality Calculator
The Kelly Criterion Calculator
Sentiment Geo Map
Public Research Reports
Free Webinar
Pricing
Company
About
Meet Our Team
In the News
Testimonials
Client Success Stories
Contact
Log inLoginSign up
< BACK TO ALL REPORTS

A broad breakout

Jason Goepfert
2020-11-10
The relief rally on Monday pushed more than 80% of S&P 500 stocks above their 200-day moving averages, and more than 25% of them to new highs. There was also a surge in positive reactions in discretionary, material, and industrial stocks.

There's a whole lot of recovery going on.

Whatever your opinion on politics, it's hard to deny that the preliminary (?) election results on Saturday followed by the Pfizer vaccine news introduced a massive shift in psychology. As a result, we saw yet another wave of overwhelming buying pressure.

It was broad-based, too. For the 1st time in nearly 9 months, more than 80% of stocks in the S&P 500 managed to close above their 200-day moving averages.

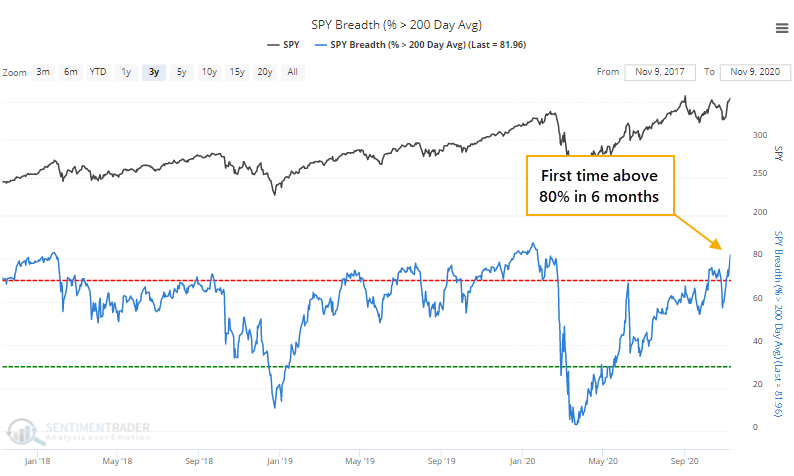
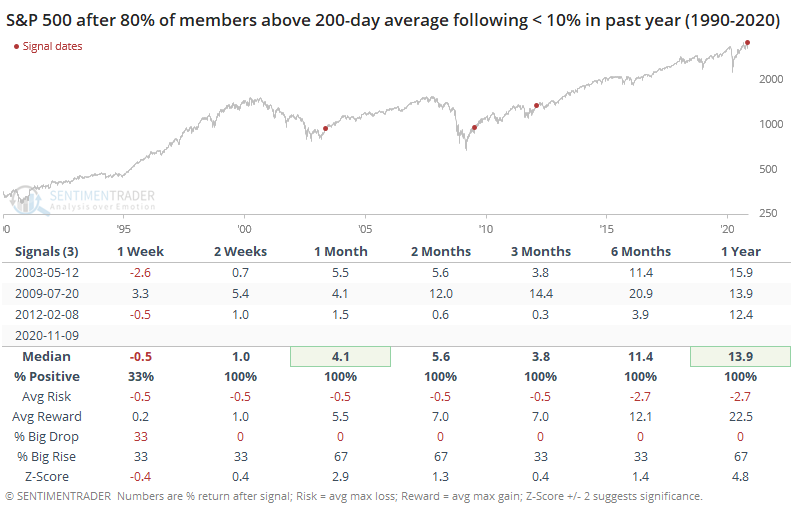
That marks a recovery from a point when fewer than 10% of stocks in the index were in uptrends. Over the past 30 years, such a cycle within a year's time has happened only 3 times, all of them very positive for forward returns.

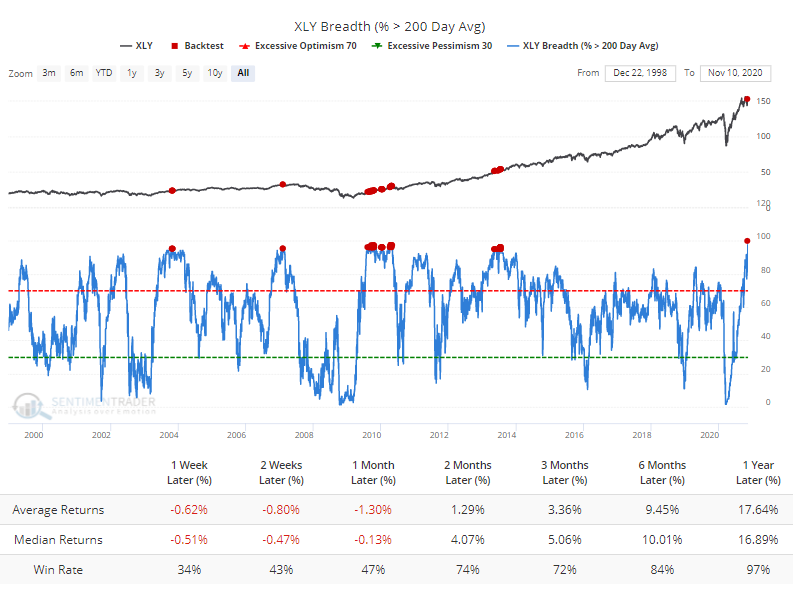
Among major sectors, every member of the Consumer Discretionary group managed to close above their 200-day average. Going back to 1990, that's never happened before. The handful of times more than 95% of the stocks did, the sector pulled back in the short-term but showed very good long-term returns according to the Backtest Engine.

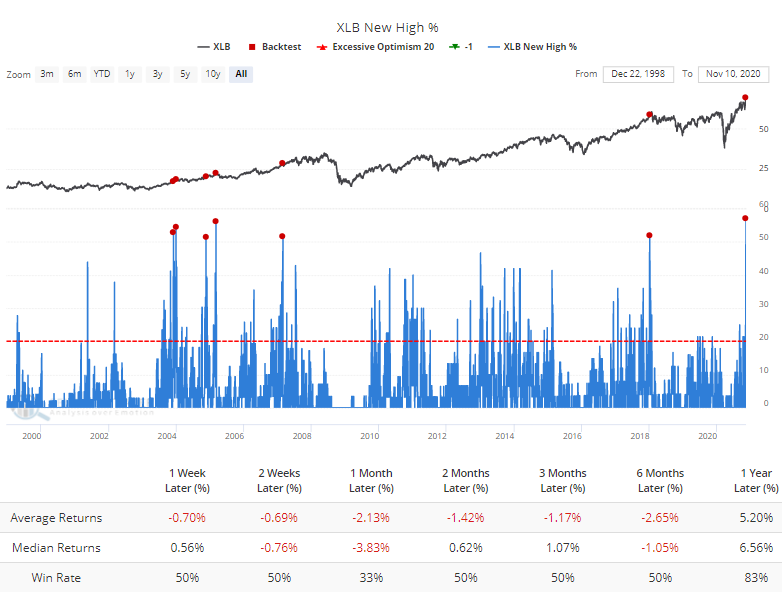
Monday's jump also triggered a wave of 52-week highs in more than a quarter of stocks in the broader S&P 500 index. A surge in new highs is usually a short-term negative as traders need to digest the gains, but when it's the first big reading in months, it has generated fairly positive long-term returns.

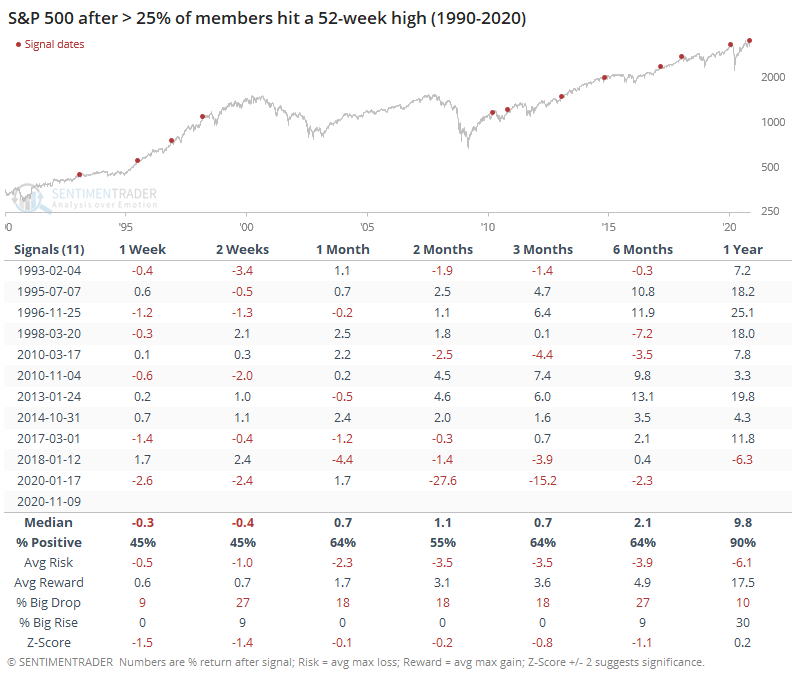
The biggest failure was earlier this year, when a surge in new highs not only led to a short-term pullback, it preceded an outright crash. That had never happened before. Granted, no other signal had to deal with a global pandemic, but we don't like to make excuses for indicators.

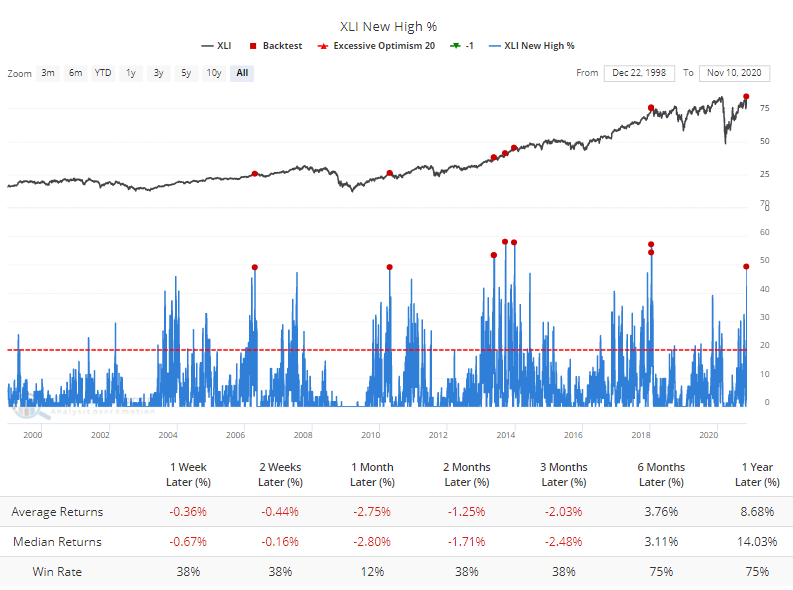
Among sectors, the most notable jumps in new highs were in Materials and Industrials. For Materials, the Backtest Engine shows some struggles after surges like this.

It was even harder for Industrials to add to their gains, with the Engine showing only 1 win out of 8 attempts over the next month. 

There is the potential that the major news events over the past few days are enough to qualify for a "this time is different" situation. That's an awfully high hurdle, so we'll have to see how things shake out - so far, there is some very early evidence that it might be. As it stands, the jump on Monday should be a long-term positive, but the short-term is riskier, especially for some of the formerly staid sectors that saw a sudden surge in interest among investors.

DATA &
TECHnologies
IndicatorEdge
‍
BackTestEdge
‍
Other Tools
‍
DataEdge API
RESEARCH
reports
Research Solution
‍
Reports Library
‍
actionable
Strategies
Trading Strategies
‍
Smart Stock Scanner
‍
FREE
RESOUrCES
Simple Backtest
Calculator
Simple Seasonality
Calculator
The Kelly Criterion
Calculator
Sentiment Geo Map
‍
Public Research Reports
‍
Free Webinar
COMPANY
‍
About
‍
Meet our Team
‍
In the News
‍
Testimonials
‍
Client Success Stories
Pricing
Bundle pricing
‍
Announcements
‍
FAQ
© 2024 Sundial Capital Research Inc. All rights reserved.
Setsail Marketing
TermsPrivacyAffiliate Program
Risk Disclosure: Futures and forex trading contains substantial risk and is not for every investor. An investor could potentially lose all or more than the initial investment. Risk capital is money that can be lost without jeopardizing ones’ financial security or life style. Only risk capital should be used for trading and only those with sufficient risk capital should consider trading. Past performance is not necessarily indicative of future results.

Hypothetical Performance Disclosure: Hypothetical performance results have many inherent limitations, some of which are described below. No representation is being made that any account will or is likely to achieve profits or losses similar to those shown; in fact, there are frequently sharp differences between hypothetical performance results and the actual results subsequently achieved by any particular trading program. One of the limitations of hypothetical performance results is that they are generally prepared with the benefit of hindsight. In addition, hypothetical trading does not involve financial risk, and no hypothetical trading record can completely account for the impact of financial risk of actual trading. for example, the ability to withstand losses or to adhere to a particular trading program in spite of trading losses are material points which can also adversely affect actual trading results. There are numerous other factors related to the markets in general or to the implementation of any specific trading program which cannot be fully accounted for in the preparation of hypothetical performance results and all which can adversely affect trading results.

Testimonial Disclosure: Testimonials appearing on this website may not be representative of other clients or customers and is not a guarantee of future performance or success.