Data &
Technology
Research
Reports
Report Solutions
Reports Library
Actionable
Strategies
Free
Resources
Simple Backtest Calculator
Simple Seasonality Calculator
The Kelly Criterion Calculator
Sentiment Geo Map
Public Research Reports
Free Webinar
Pricing
Company
About
Meet Our Team
In the News
Testimonials
Client Success Stories
Contact
Log inLoginSign up
< BACK TO ALL REPORTS

A Breadth Thrust That Acts More Like a Blow-Off

Jason Goepfert
2021-09-09
Over the past 10 days, stocks on the Nasdaq exchange have shown an impressive upward breadth thrust.

Stocks traded on the NYSE decided to make a fool out of those worried about weak breadth. Last week, the Nasdaq joined the party.

After weeks of disturbingly poor internal participation, and a flurry of technical warning signs, stocks on the Nasdaq thrust higher last week. Over the past 10 days, an average of more than 60% of securities on the Nasdaq advanced.

Nasdaq up issues ratio

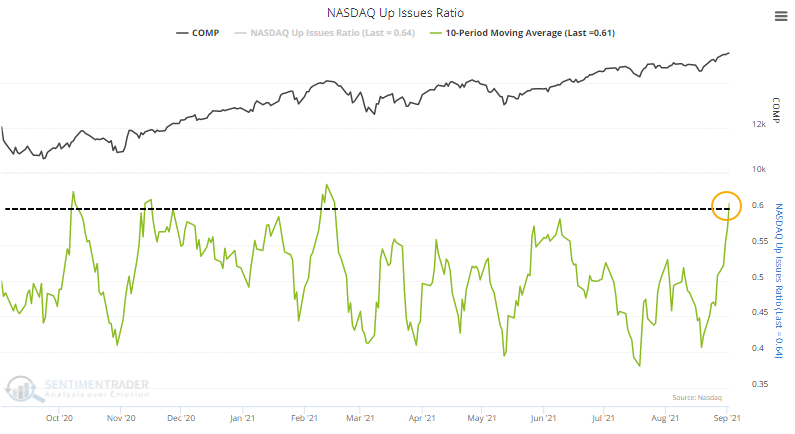
Even more impressively, more than 65% of volume flowed into advancing issues on average each day. Granted, volume at the end of August tends to be low, but it was still focused on the winners.

As we so often see after thrusts like this, the most notable aspect was the ridiculously skewed risk/reward ratio during the past 50 years. Over the next three months, only one signal showed a loss at its worst point of more than -4.1%.

Here's the rub, though...

Oddly, the thrust triggered when the Composite was trading at a new high. Most of them came after protracted declines. Out of all the signals, only three others triggered with the Composite at (or even near) a multi-year high...and each of them was also a blow-off peak.


What else we're looking at

  • Full details on Nasdaq and S&P performance following breadth thrust on the Nasdaq
  • What happens after a breadth thrust in Japan's Nikkei 225 index
  • Using sector breadth as a market-wide heads-up warning sign
Stat box

The SPY fund saw an outflow of more than $4.3 billion on Wednesday, the 3rd-largest of 2021. The most important ETF in the world, focused on the S&P 500 index, has been seeing unusually large swings in assets given relatively tame price moves.

Etcetera

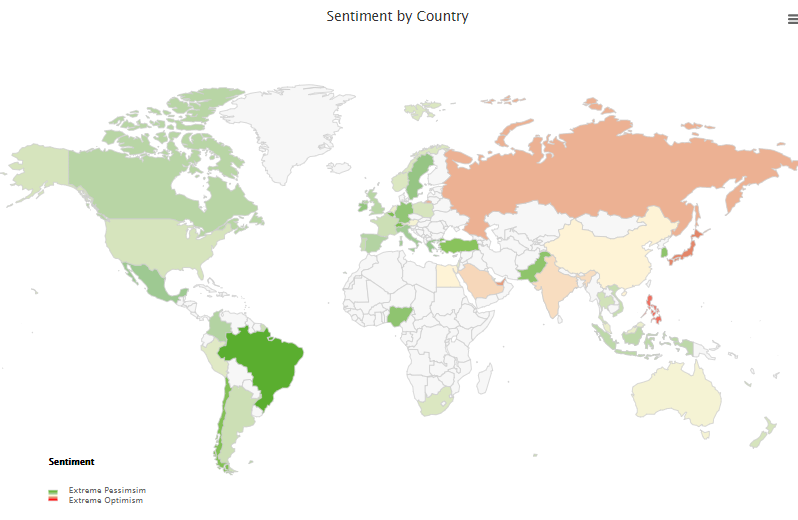
East vs. West. Our Optimism Index Geo-Map shows that traders are showing pessimism (green) mostly in western countries while showing optimism in eastern countries.

optimism index geo map

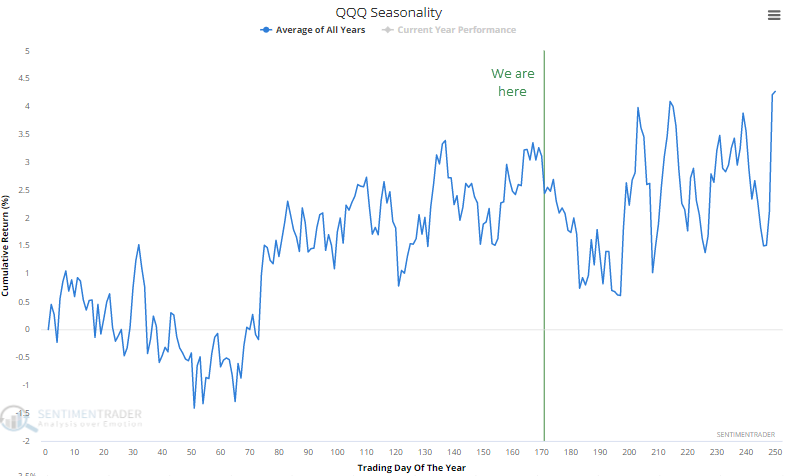
Can tech buck the trend? The QQQ Nasdaq 100 fund has peaked around this time in a typical year since its inception.

qqq nasdaq 100 seasonality

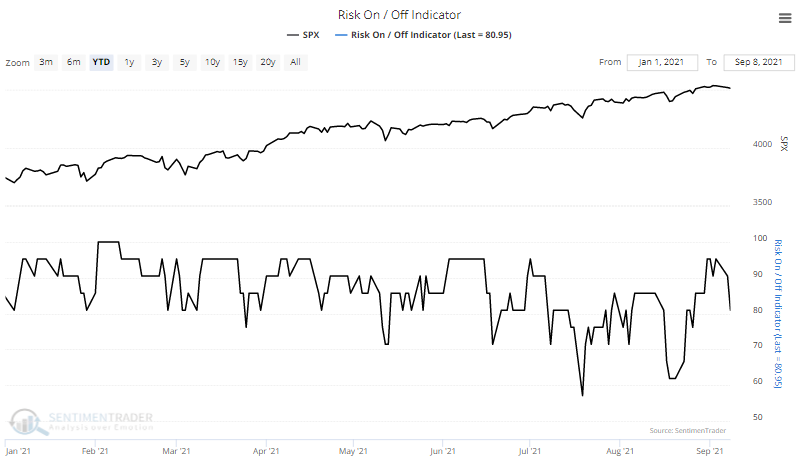
Risk easing. The Risk-On/Risk-Off Indicator recently showed more than 95% of indicators in "risk-on" mode, among the highest percentages this year, but investors' behavior is now starting to ease back from that extreme.

risk on risk off indicator sentiment

DATA &
TECHnologies
IndicatorEdge
‍
BackTestEdge
‍
Other Tools
‍
DataEdge API
RESEARCH
reports
Research Solution
‍
Reports Library
‍
actionable
Strategies
Trading Strategies
‍
Smart Stock Scanner
‍
FREE
RESOUrCES
Simple Backtest
Calculator
Simple Seasonality
Calculator
The Kelly Criterion
Calculator
Sentiment Geo Map
‍
Public Research Reports
‍
Free Webinar
COMPANY
‍
About
‍
Meet our Team
‍
In the News
‍
Testimonials
‍
Client Success Stories
Pricing
Bundle pricing
‍
Announcements
‍
FAQ
© 2024 Sundial Capital Research Inc. All rights reserved.
Setsail Marketing
TermsPrivacyAffiliate Program
Risk Disclosure: Futures and forex trading contains substantial risk and is not for every investor. An investor could potentially lose all or more than the initial investment. Risk capital is money that can be lost without jeopardizing ones’ financial security or life style. Only risk capital should be used for trading and only those with sufficient risk capital should consider trading. Past performance is not necessarily indicative of future results.

Hypothetical Performance Disclosure: Hypothetical performance results have many inherent limitations, some of which are described below. No representation is being made that any account will or is likely to achieve profits or losses similar to those shown; in fact, there are frequently sharp differences between hypothetical performance results and the actual results subsequently achieved by any particular trading program. One of the limitations of hypothetical performance results is that they are generally prepared with the benefit of hindsight. In addition, hypothetical trading does not involve financial risk, and no hypothetical trading record can completely account for the impact of financial risk of actual trading. for example, the ability to withstand losses or to adhere to a particular trading program in spite of trading losses are material points which can also adversely affect actual trading results. There are numerous other factors related to the markets in general or to the implementation of any specific trading program which cannot be fully accounted for in the preparation of hypothetical performance results and all which can adversely affect trading results.

Testimonial Disclosure: Testimonials appearing on this website may not be representative of other clients or customers and is not a guarantee of future performance or success.