Data &
Technology
Research
Reports
Report Solutions
Reports Library
Actionable
Strategies
Free
Resources
Simple Backtest Calculator
Simple Seasonality Calculator
The Kelly Criterion Calculator
Sentiment Geo Map
Public Research Reports
Free Webinar
Pricing
Company
About
Meet Our Team
In the News
Testimonials
Client Success Stories
Contact
Log inLoginSign up
< BACK TO ALL REPORTS

A breadth indicator with a perfect record triggered a buy signal

Dean Christians
2024-03-13
For only the 16th time since 1928, the percentage of S&P 500 stocks trading within 5% of their 252-day high cycled from less than 10% to greater than 50%. Similar precedents preceded a 100% win rate for the S&P 500 over the ensuing month and highly favorable outcomes over the longer time horizons.

Key points:

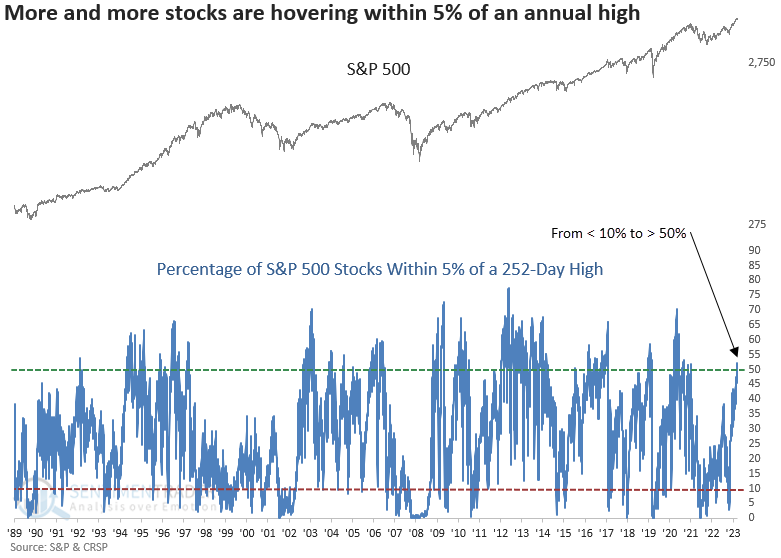
  • A majority of S&P 500 stocks closed within 5% of their respective 252-day highs
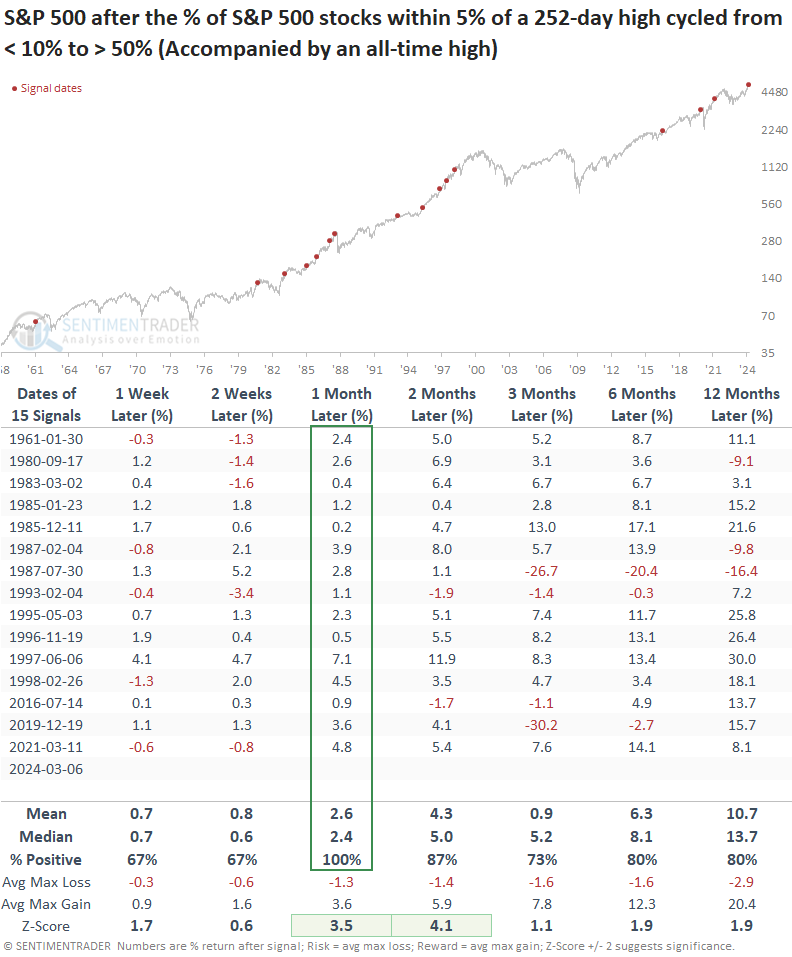
  • Similar long-term trend conditions preceded a 100% win rate over the subsequent month
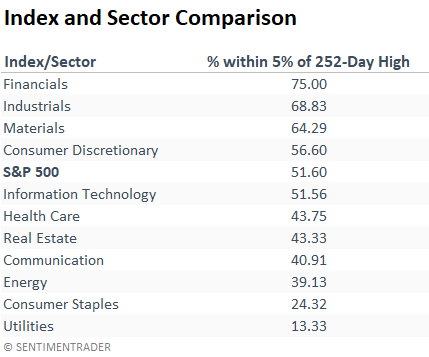
  • Financials, Industrials, Materials, and Consumer Discretionary stocks maintain the highest readings

The big-picture backdrop continues to exhibit bull market behavior

Last week, as I was enjoying some time away with the family, one of the long-term breadth indicators I monitor generated a new buy signal.

The indicator gauges the proportion of S&P 500 stocks trading within 5% of their 252-day high, offering a slightly different breadth-based assessment of long-term trend conditions.

A signal triggers when the indicator cycles from less than 10% to greater than 50%. 

The previous alert occurred in March 2021, resulting in a 14% gain over six months. More importantly, that precedent occurred well in advance of the S&P 500's January 2022 peak, a common trait when participation is broadening, like now.

Similar long-term trend conditions preceded a positive outlook for stocks

Whenever the percentage of S&P 500 stocks trading within 5% of their respective 252-day high shifted from under 10% to over 50%, in tandem with the index reaching an all-time high, the world's most benchmarked index exhibited outstanding returns and win rates across all time horizons. That was especially the case in the near term, with the S&P 500 registering a gain 100% of the time over the following month.

Despite the worrisome signals in 1987 and 2019, it's crucial to remember that crash events are exceptionally rare. 

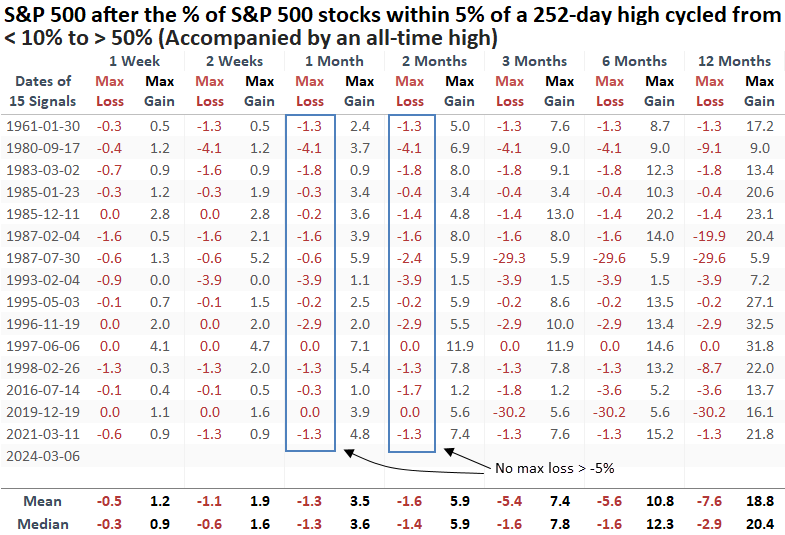
Meaningful drawdowns were conspicuously minimal in the ensuing two months, with no precedent surpassing a maximum loss of -5%. 

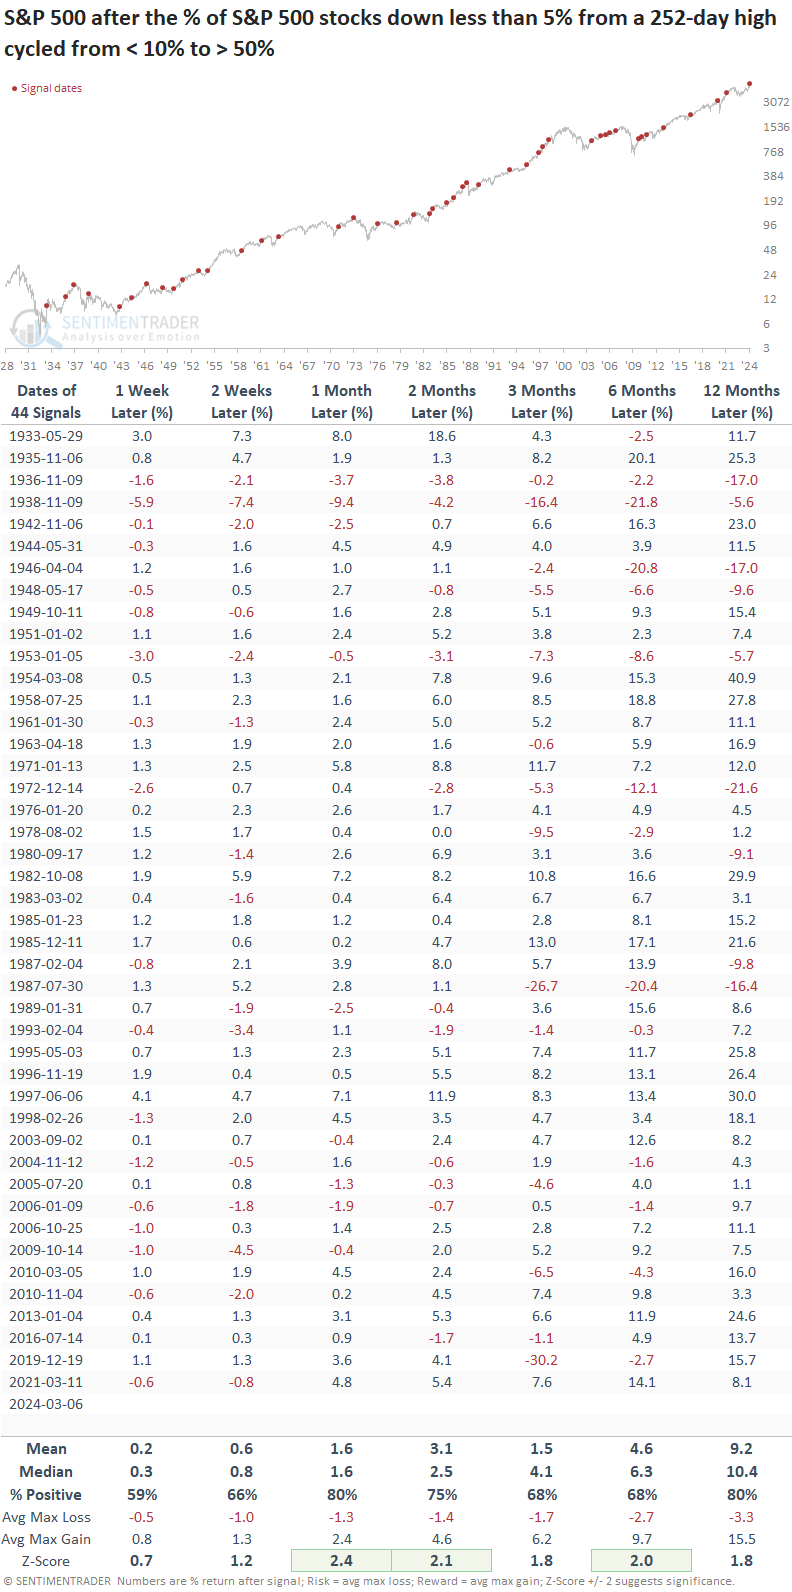
This outlook table offers a comprehensive view of all signals, excluding the all-time high condition. While it delivers solid results, I thought it was worth highlighting that the win rates and returns for these signals lagged behind those observed at an all-time high. When trading signals coincide with an all-time high, performance typically experiences a drop-off. 

This is why I really like this indicator/signal.

The percentage of S&P 500 Technology stocks within 5% of a 252-day high peaked in December 2023 after increasing to 68.75%. While Technology has faltered, other cyclical sectors have flourished and filled the void. 

What the research tells us...

The S&P 500 and other widely followed indexes continue to march higher, exhibiting healthy price and participation trends. From a big-picture perspective, the backdrop increasingly resembles the steady uptrends exhibited in 2013 or 2017. The latest indicator to add credence to this scenario is the percentage of S&P 500 stocks trading within 5% of their respective 252-day high. When it shifts from less than 10% to greater than 50%, the S&P 500 trended upward over the following year. While near-term results show an undefeated record and minimal drawdowns, the market has come a long way over the last four months. Sometimes, equity indexes correct internally via sector rotation, with limited damage to the overall index. That could be occurring now with technology and semiconductors.

Sorry, you don't have access to this report

Upgrade your subscription plan to get access
Go to Dasboard
DATA &
TECHnologies
IndicatorEdge
‍
BackTestEdge
‍
Other Tools
‍
DataEdge API
RESEARCH
reports
Research Solution
‍
Reports Library
‍
actionable
Strategies
Trading Strategies
‍
Smart Stock Scanner
‍
FREE
RESOUrCES
Simple Backtest
Calculator
Simple Seasonality
Calculator
The Kelly Criterion
Calculator
Sentiment Geo Map
‍
Public Research Reports
‍
Free Webinar
COMPANY
‍
About
‍
Meet our Team
‍
In the News
‍
Testimonials
‍
Client Success Stories
Pricing
Bundle pricing
‍
Announcements
‍
FAQ
© 2024 Sundial Capital Research Inc. All rights reserved.
Setsail Marketing
TermsPrivacyAffiliate Program
Risk Disclosure: Futures and forex trading contains substantial risk and is not for every investor. An investor could potentially lose all or more than the initial investment. Risk capital is money that can be lost without jeopardizing ones’ financial security or life style. Only risk capital should be used for trading and only those with sufficient risk capital should consider trading. Past performance is not necessarily indicative of future results.

Hypothetical Performance Disclosure: Hypothetical performance results have many inherent limitations, some of which are described below. No representation is being made that any account will or is likely to achieve profits or losses similar to those shown; in fact, there are frequently sharp differences between hypothetical performance results and the actual results subsequently achieved by any particular trading program. One of the limitations of hypothetical performance results is that they are generally prepared with the benefit of hindsight. In addition, hypothetical trading does not involve financial risk, and no hypothetical trading record can completely account for the impact of financial risk of actual trading. for example, the ability to withstand losses or to adhere to a particular trading program in spite of trading losses are material points which can also adversely affect actual trading results. There are numerous other factors related to the markets in general or to the implementation of any specific trading program which cannot be fully accounted for in the preparation of hypothetical performance results and all which can adversely affect trading results.

Testimonial Disclosure: Testimonials appearing on this website may not be representative of other clients or customers and is not a guarantee of future performance or success.