Products
SentimenTrader Trading Tools
‍
Backtest Engine
My Trading Toolkit
Correlation Analysis
Seasonality
Market Prediction
Indicators & Data API
‍
Proprietary Indicators & Charts
Market Data API
Strategies & Scanner
‍
50+ Trading Strategies
Smart Stock Scanner
Smart Option Scanner
Research Reports
‍
Research Solutions
Reports Library
Free Resources
Simple Backtest Calculator
Simple Seasonality Calculator
The Kelly Criterion Calculator
Sentiment Geo Map
Public Research Reports
Education
Sentiment Indicators
Technical Indicators
Pricing
Company
About
In the News
Testimonials
Client Success Stories
Contact
Log inLoginSign up
< BACK TO ALL REPORTS

A Boring but Consistent January Portfolio

Jay Kaeppel
2021-01-12
Certain types of bonds have historically shown consistent results during the month of January.

If we were to name three things that encompass most investors primary desires they would likely be:

  • Return
  • Consistency
  • Low volatility

Each investor must decide for themselves what priority to put on each of the above. In these days of "Bitcoin/Tech/Tesla/Growth", it seems that "return" is the "Belle of the Ball." As such, what follows may not "float a lot of people's boat."  This is because we are going to talk about a consistent, low volatility two fund portfolio built solely for the month of January.   Still, there is something to be said for consistency and low volatility.

The "January Two"

For testing purposes, we will use Vanguard High Yield (ticker VWEHX) and Vanguard Intermediate-Term Tax-Exempt Fund (VWITX) because we have data going back to 1979. Because of switching restrictions, for actual trading purposes one would more likely be better served with an ETF such as MUB for municipal bonds and HYG or JNK for high yield bonds (other potential proxies in this "correlated to the stock market" space include tickers CWB and ANGL).  

The Test

For testing purposes we will assume a hypothetical 50/50 split between VWEHX and VWITX every year (using monthly total return data) ONLY during the month of January. The year-by-year results appear below.

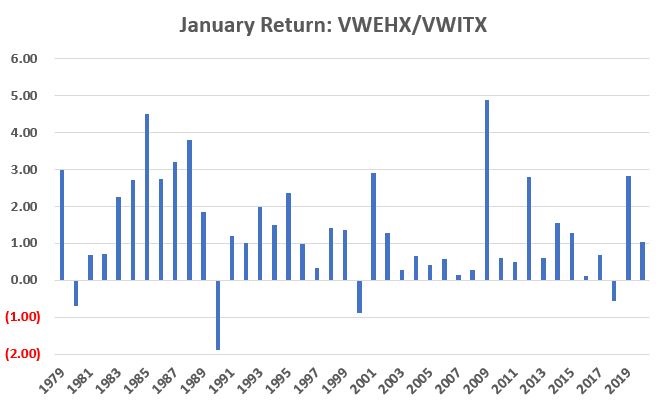
For the record, the Junk/Muni Combo:

*Showed a gain 38 times in 42 years (90.5% of the time)

*The average return was +1.36% (which works out to 17.4% annualized)

*The "worst" January was 1990 which showed a loss of (-1.30%)

The chart below displays the hypothetical cumulative gain achieved by holding these two funds only during the month of January every year starting in 1979 through 2020.

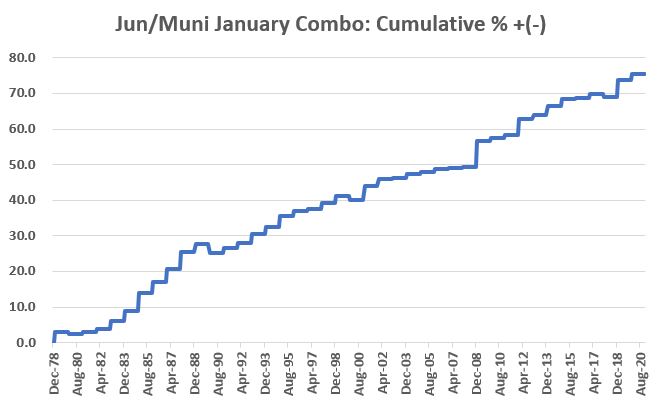
Is this a viable, actionable idea? Well, that's not for me to say. It's only a 1-month trade and the returns are good on an annualized basis but not "eye-popping" on a raw 1-month basis. 

Still, anything that is 90% accurate over 40+ years is probably at the very least worth knowing about. 

So now you know.

PRODUCTS
SentimenTrader
Trading Tools
Indicators & Data API
‍
Strategies & Scanner
‍
Research Reports
FREE
RESOUrCES
Simple Backtest
Calculator
Simple Seasonality
Calculator
The Kelly Criterion
Calculator
Sentiment Geo Map
‍
Public Research Reports
‍
Education
Sentiment Indicators
‍
Technical Indicators
‍
Pricing
Bundle pricing
‍
FAQ
‍
Announcements
‍
COMPANY
‍
About
‍
In the News
‍
Testimonials
‍
Client Success Stories
CONTACT
‍
General Inquiries
‍
Media Inquiries
‍
Financial Professionals Inquiries
‍
© 2026 Sundial Capital Research Inc. All rights reserved.
Setsail Marketing
TermsPrivacyAffiliate Program
Risk Disclosure: The information and tools provided are for research and analytical purposes only and are not intended as investment advice. Market analysis involves uncertainty, and outcomes may differ from expectations. Users should conduct their own due diligence and consider their individual circumstances before making any financial decisions. Past performance is not necessarily indicative of future results.

Hypothetical Performance Disclosure: Hypothetical performance results have many inherent limitations, some of which are described below. No representation is being made that any account will or is likely to achieve profits or losses similar to those shown; in fact, there are frequently sharp differences between hypothetical performance results and the actual results subsequently achieved by any particular trading program. One of the limitations of hypothetical performance results is that they are generally prepared with the benefit of hindsight. In addition, hypothetical trading does not involve financial risk, and no hypothetical trading record can completely account for the impact of financial risk of actual trading. for example, the ability to withstand losses or to adhere to a particular trading program in spite of trading losses are material points which can also adversely affect actual trading results. There are numerous other factors related to the markets in general or to the implementation of any specific trading program which cannot be fully accounted for in the preparation of hypothetical performance results and all which can adversely affect trading results.

Testimonial Disclosure: Testimonials appearing on this website may not be representative of other clients or customers and is not a guarantee of future performance or success.