
A Big Breadth Turnaround

With internal weakness that's been festering for a while, then a dip in most stocks to end last week, some sensitive breadth measures neared oversold territory. Monday's surge took care of much of that.
Traders get excited when there is a lopsided day in the markets. On Monday, it was all-aboard to the upside, with few stocks failing to rise. There have been more than 450 net advancing stocks within the S&P 500 only five other times in the past five years when SPY was above its 200-day moving average.
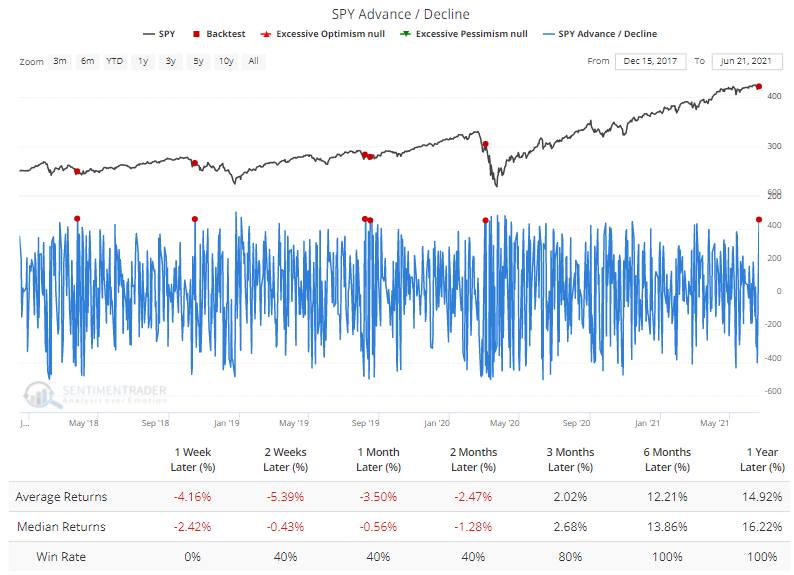
For what it's worth, all five saw the S&P trade lower over the next week before rebounding. To run this same backtest, click this link, then Run Backtest. It takes less than 10 seconds to test your assumptions.
BIG DAY, ALMOST A NEW HIGH
Going back to 1928, Monday was among the best breadth days ever, with more than 90% of its stocks advancing, when the S&P was sitting within 1% of a multi-year high. It never happened from 1928 through 1986.
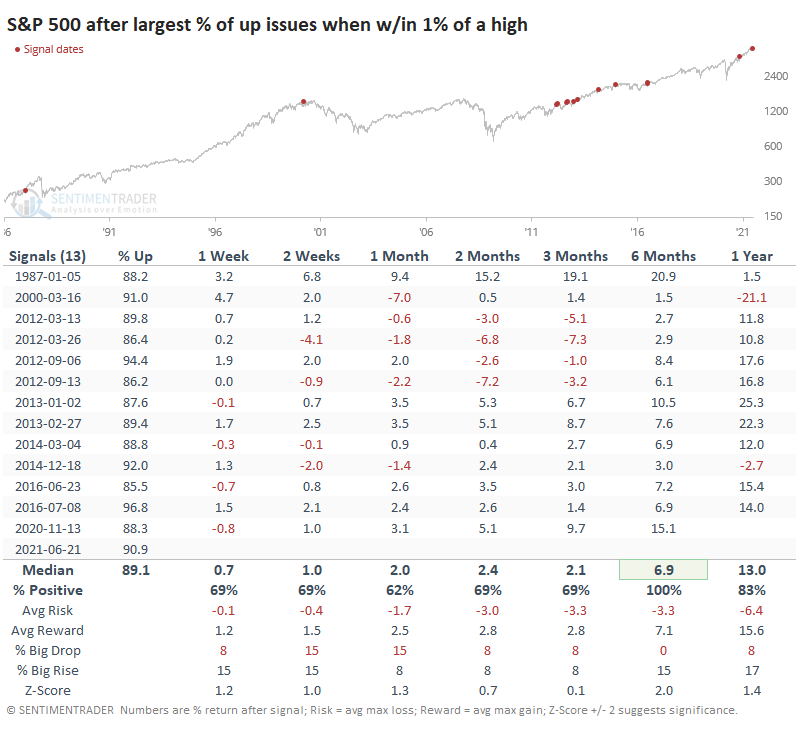
This showed more positive results across all time frames, especially over the next six months. Not sure we want to read too much into six-month returns following a one-day signal, but it is what it is. It did kinda-sorta lead to blow-off conditions in 1987, 2000, 2012, and 2015 but took a while to play out.
PLUNGE IN MEDIUM-TERM UPTRENDS WITHIN A GOOD ENVIRONMENT
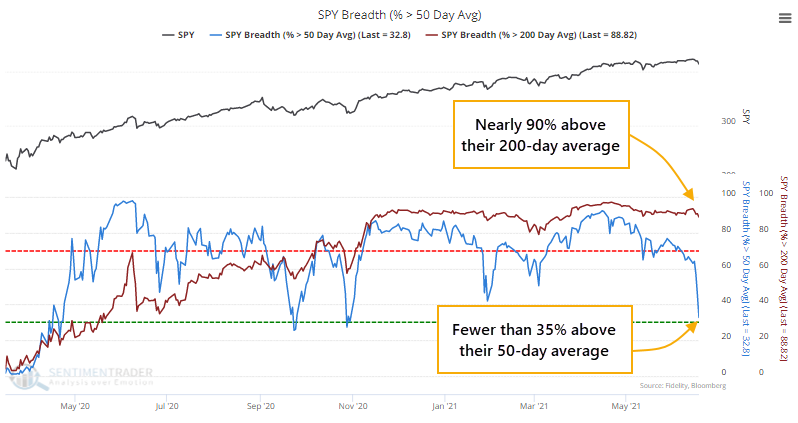
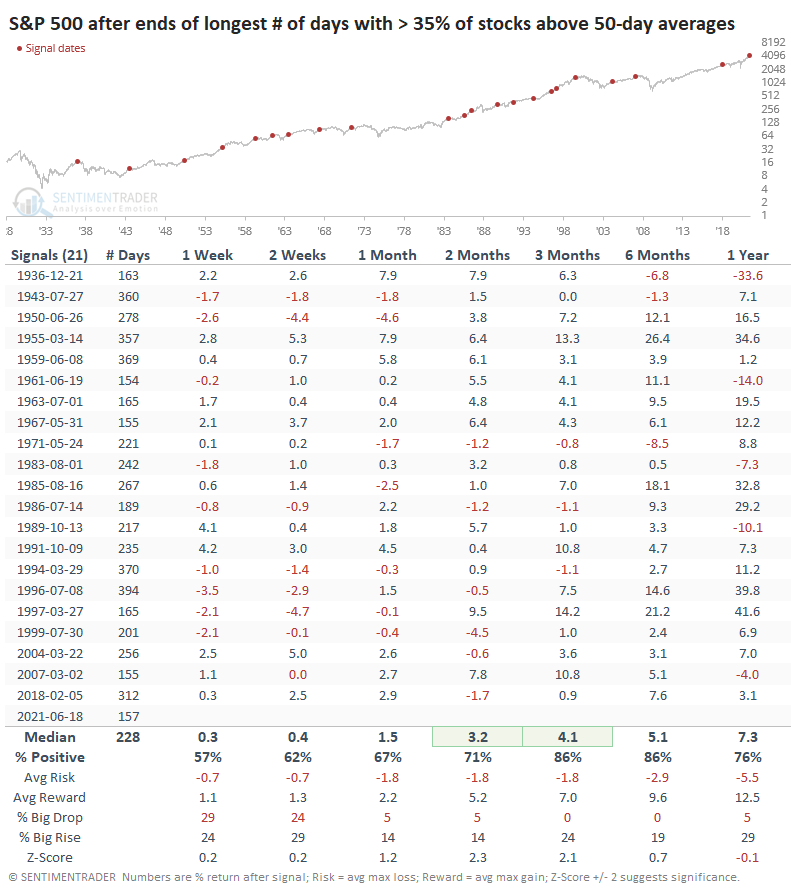
Before Monday's surge, for only the third time since the pandemic low, fewer than 35% of S&P 500 stocks were holding above their 50-day moving averages.
This ended a streak of more than seven months with more than 35% of S&P 500 stocks above their averages, the longest streak in over three years and ranking as one of the longest since 1927.
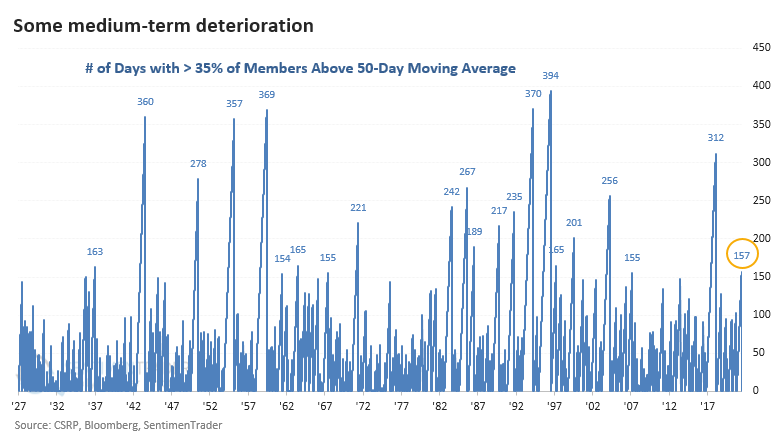
The ends of other long streaks rarely resulted in sustained downside. Over the next two and three months, the S&P showed much better-than-average returns and risk/reward skew. Three months later, there were no losses larger than -1.1%, an impressive feat.
 The chart above shows that despite the drop in stocks holding above their 50-day averages, nearly 90% of them were still above their 200-day averages. That's the most stocks we've ever seen above their long-term averages when there was a big drop in medium-term uptrends.
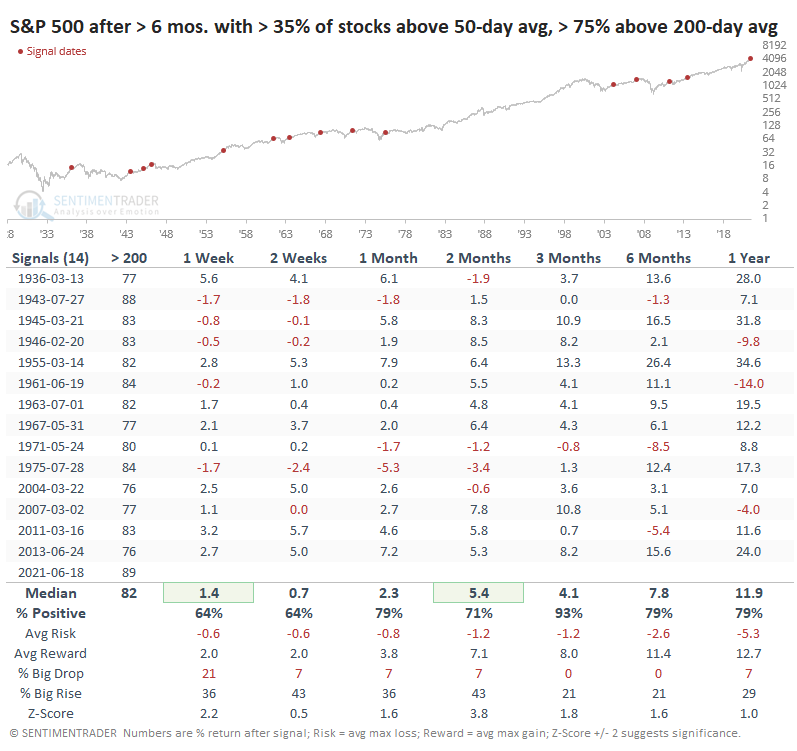
Other times that stocks carved out similar patterns, the S&P rallied in the months ahead. Over the next three months, 13 out of 14 signals showed a positive return, and the sole loss was smaller than -1%.
There are some concerns, with high levels of speculation preceding enough weakness to trigger some internal warnings and even a Dow Theory sell signal. Monday's big up day doesn't change that much, as we've seen over the past five years. Since we're still not seeing a large and sustained deterioration in longer-term trends, though, it's hard to become too negative just yet.