
A bearish divergence for the Nasdaq 100

Key points:
- The Nasdaq 100 triggered a warning when stocks in medium-term uptrends diverged from the index
- Similar precedents suggest the popular Nasdaq index could struggle over the next few weeks
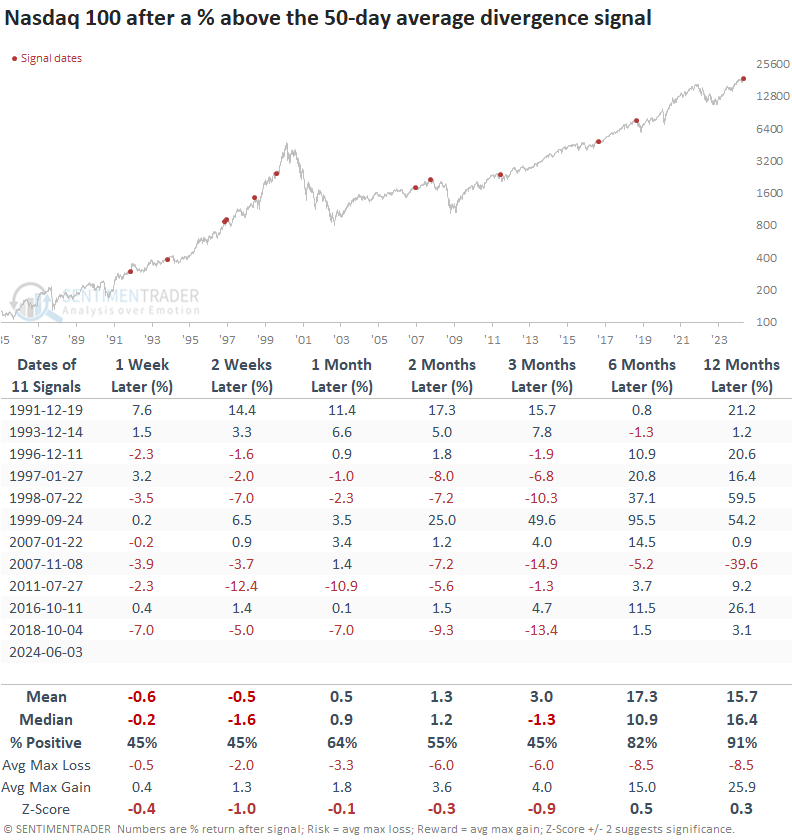
- A year later, the NDX 100 was higher 91% of the time, suggesting this is a countertrend move in an uptrend
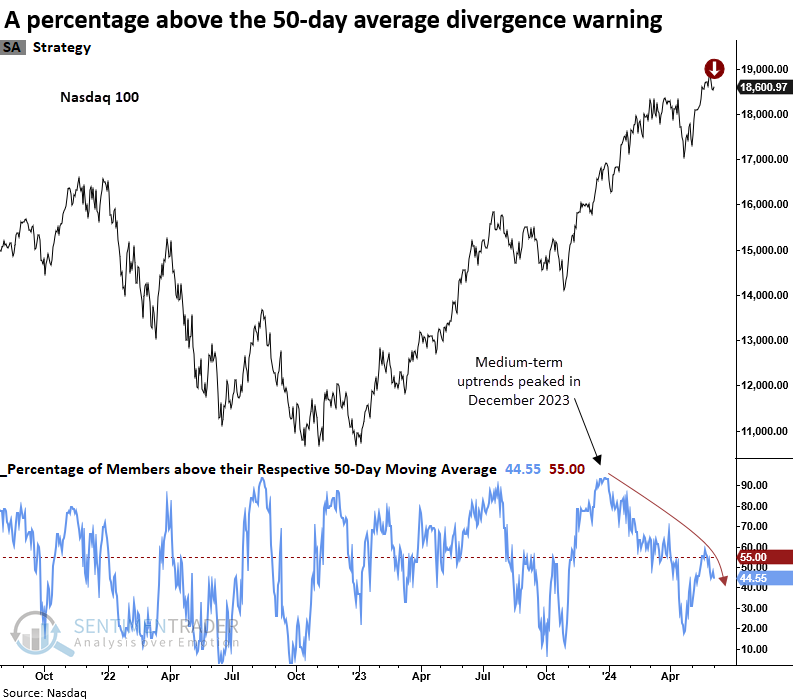
Medium-term uptrends for Nasdaq 100 stocks diverge from the underlying index
Last week, my Risk-Off Composite Model triggered a warning. One of the composite members that did not contribute to the signal was a model that identifies a divergence between the index and the percentage of issues above their 50-day average, highlighting periods where fewer stocks participate in medium-term uptrends.
One reason the model, which I monitor across numerous indexes, has yet to trigger warnings despite an abysmal number of stocks in medium-term uptrends is due to one of the system parameters. This condition does not permit a warning to occur if the percentage of members above the 50-day average exceeds 90% over the last five months because this is considered a breadth thrust. I want to avoid getting defensive in the face of bullish momentum.
Just how abysmal have medium-term uptrends been? On May 23rd, 2024, seven out of nine S&P 500 sectors showed fewer than 50% of their members above their respective 50-day average, with the S&P 500 two days removed from a high and only 1% below that high. That has never happened since 1952.
The Nasdaq 100's percentage of stocks above their 50-day average last eclipsed 90% in December 2023. Therefore, its five-month momentum window expired in May. On Monday, the 50-day average divergence model triggered a new warning for the Nasdaq 100, the first precedent since October 2018.
To learn more about the model concept, click here. The NDX 100 version uses slightly different parameters.
A slightly different take on participation trends
Recently, the percentage of Nasdaq 100 stocks outperforming the index over a rolling 63-day period dropped to its lowest point since 1997, highlighting an environment where most stocks cannot keep pace with the index. 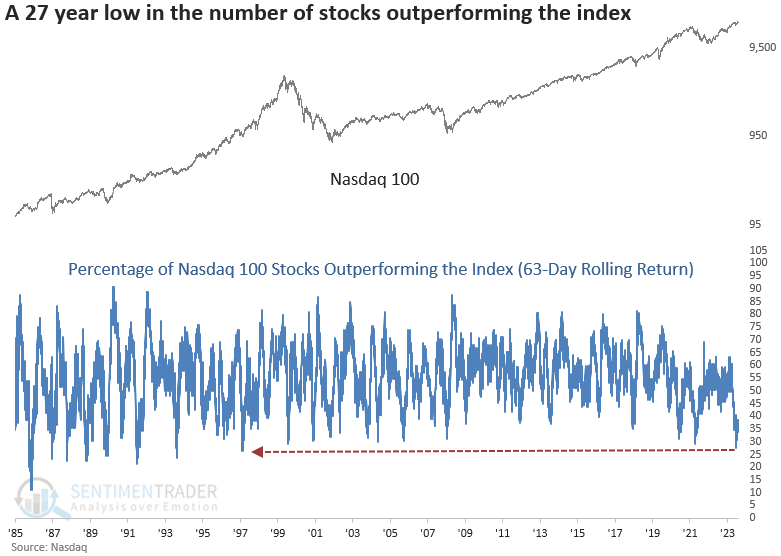
The 50-day divergence model suggests a pause that refreshes an uptrend
Following a percentage above the 50-day average divergence warning, the Nasdaq 100 tended to struggle over a medium-term basis with negative returns and unfavorable win rates in 3 out of 5 horizons. Over the following three months, the maximum loss exceeded the maximum gain in all periods.
Once the corrective phase ended, the popular Nasdaq index rallied over longer time frames, displaying excellent returns and consistency, especially a year later.
What the research tells us...
Whether it's a comprehensive composite, like the Risk-Off Composite Model, or a single indicator, as discussed in today's note, breadth-based warnings aim to provide investors with an early heads-up of a potential countertrend move. These warnings can sometimes foreshadow a trend change, while other times, they represent the normal ebbs and flows in a bull market. Similar 50-day divergence signals for the Nasdaq 100 suggest a countertrend corrective phase in an ongoing bull market. Given this scenario, traders and investors would be well-advised to exercise patience in the short term, as the choppy conditions can frustrate even the most seasoned market participants.