
A bearish breakdown for the Shanghai Composite

Key points:
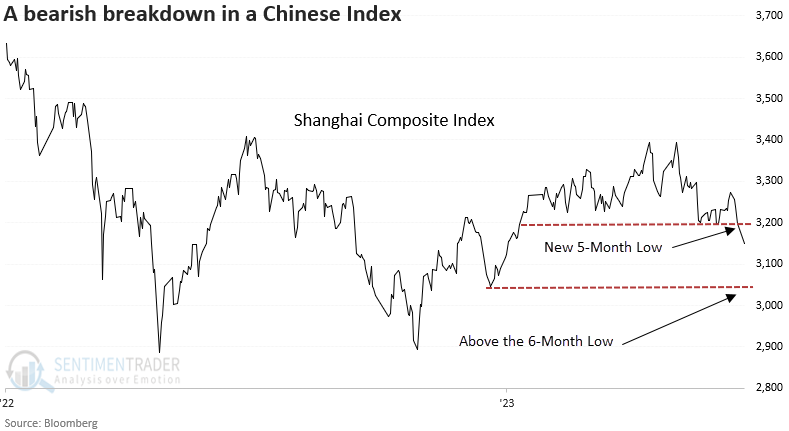
- The Shanghai Composite closed at a 5-month low but not a 6-month low
- The base breakdown signal represents the first instance after a 5-month high
- Comparable price patterns foreshadowed an unfavorable outlook over the next two months
Chinese indexes did not fare well in the face of more accommodative monetary measures
After a ten-month hiatus, China's central bank lowered its one and five-year main benchmark lending rates. The decision immediately impacted Chinese indexes like the Shanghai Composite, which declined by almost 3% over two trading sessions.
The swoon pushed the index to a 5-month low, triggering a base breakdown price pattern.
When markets react negatively to positive stimulus, pay attention as it typically signals something is wrong from a big-picture perspective.
Similar base breakdowns preceded negative returns
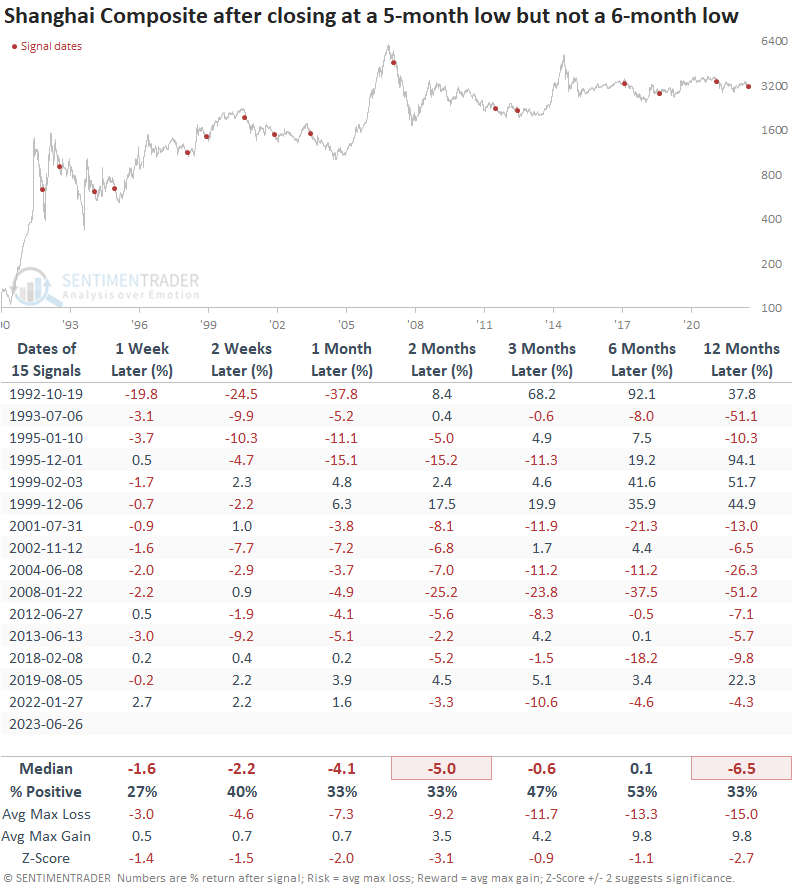
When the Shanghai Composite Index reaches a 5-month low but not a 6-month low, the Chinese Index displays a negative return in all time frames except for one over the next year. And that medium return was barely positive.
At some point over the next two months, the index was negative every time.
For context, I identified the first instance after a 5-month high, similar to now.
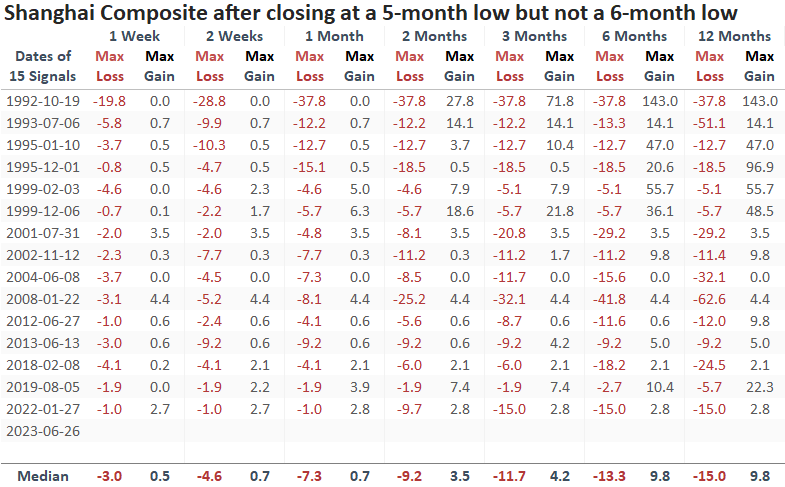
A week later, the max loss exceeded the max gain in every precedent.
What USD-based investors should keep an eye on once the dust settles
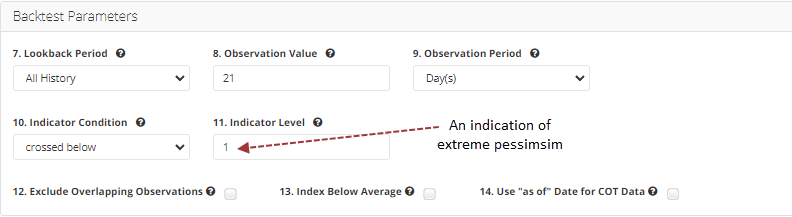
The Backtest Engine, which we are upgrading with more features, is an excellent tool for generating trade ideas. For example, website subscribers can create a scan for the iShares China Large-Cap ETF (FXI) to identify precedents when the Optimism Index (Optix) for China falls below a threshold of 1, a condition associated with extreme pessimism.
The Optix Index for the China ETF (FXI) currently stands at 12.73.
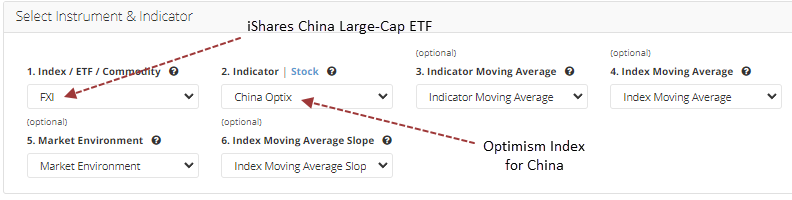
Developing a trade idea in the Backtest Engine is an easy and user-friendly process that doesn't require any programming skills. Most parameters come with a dropdown menu, allowing you to select from multiple options. If a parameter doesn't have a pre-set list, you can simply enter your own choice.
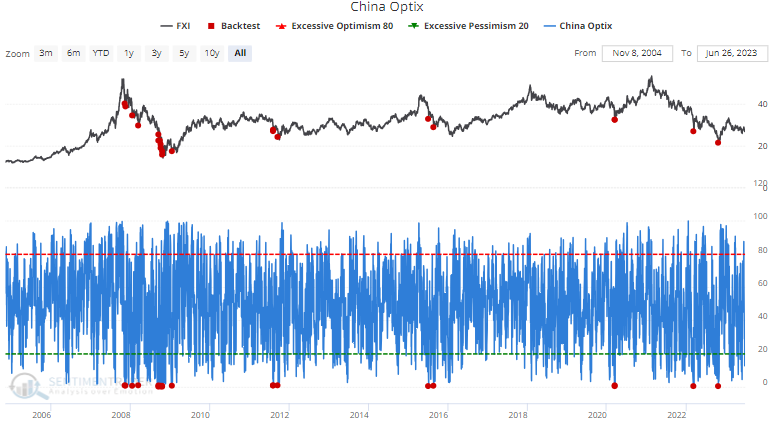
The Backtest Engine plots the signal dates on a chart so you can visualize the trade idea across time. As the chart indicates, an Optix reading for the China ETF (FXI) below 1 is rare.
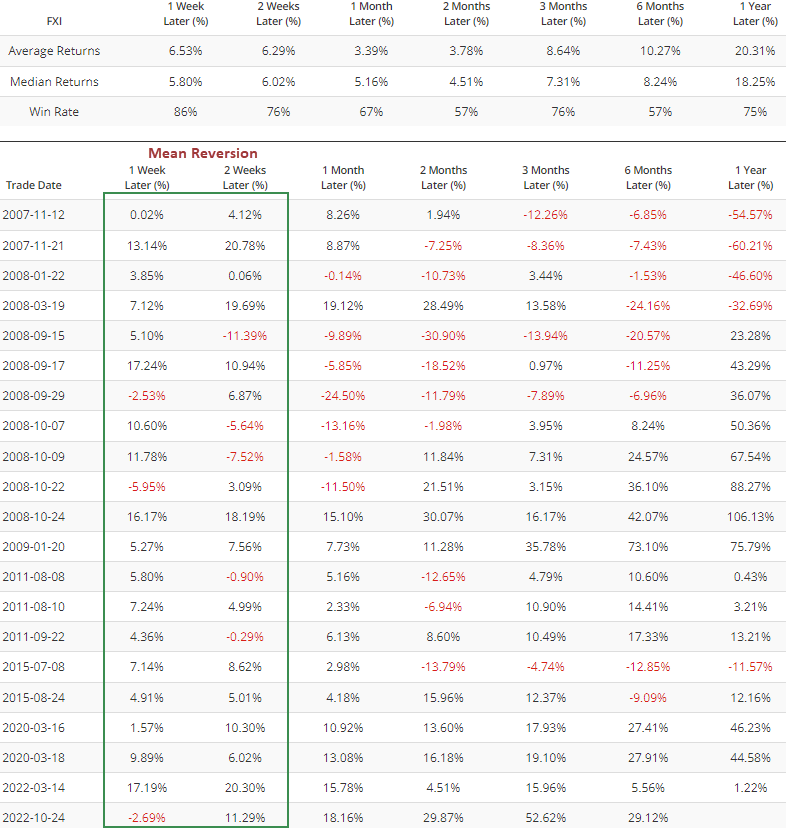
Of course, the most valuable feature of the Backtest Engine is the outlook table, which is similar to the one we provide in our research notes.
The new Backtest Engine will contain the z-score and max gain/loss statistics.
So, while China remains in the penalty box for the foreseeable future, should the Optimism Index decline to an extreme level, the potential for a mean reversion trade looks good. When the indicator falls below 1, the FXI ETF closed higher at some point over the next two weeks every time.
Click here for the China ETF (FXI) Backtest Engine scan.
What the research tells us...
The Shanghai Composite Index is breaking down, despite easier monetary policy conditions from the Chinese central bank. When a market fails to rally on bullish news, pay attention. Similar base breakdowns led to negative returns across almost every time frame over the next year. The negative outlook was especially notable over the next week and up to two months later. I will be keeping an eye on the Optimims Index for the China ETF (FXI). Should the Optix index fall to a highly pessimistic level below 1, the potential for a mean reversion trade looks excellent.