A Bad Case Of The Splits
This is an abridged version of our recent reports and notes. For immediate access with no obligation, sign up for a 30-day free trial now.
A bad case of the splits
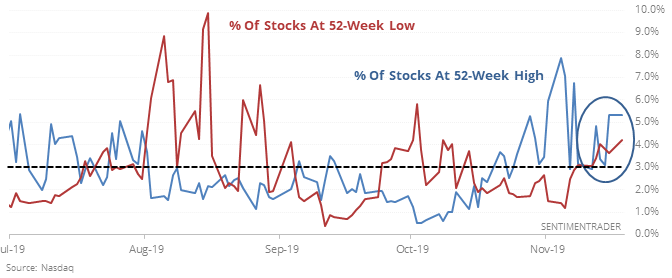
The Nasdaq exchange continues to see an abnormally large number of stocks hitting 52-week highs and 52-week lows. More than 3% of securities on the exchange have hit either extreme for a week straight.

A couple of times, the Nasdaq continued to power higher after similar setups, recovering from the split with no damage. Those were the outliers, though, and even if the Nasdaq ultimately resumed its uptrend, in tended to see some volatility over the short- to medium-term.
This split in the market is one of the conditions that has helped trigger a Hindenburg Omen for 4 straight sessions, something that has led to trouble over the past 20 years.

VIX
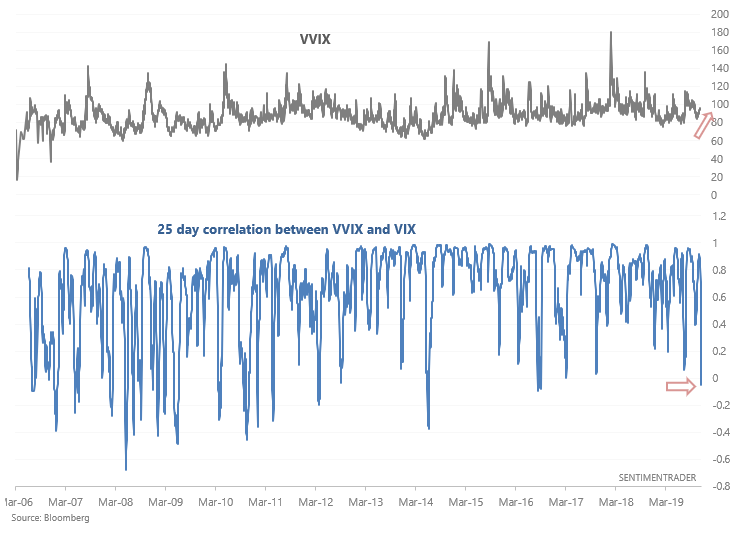
As Andrew Thrasher pointed out, the 25 day correlation between VVIX and VIX has fallen into negative territory. This is somewhat concerning since:
- These 2 indicators tend to be positively correlated, and...
- VIX is quite low, which increases the chances of a spike in volatility.

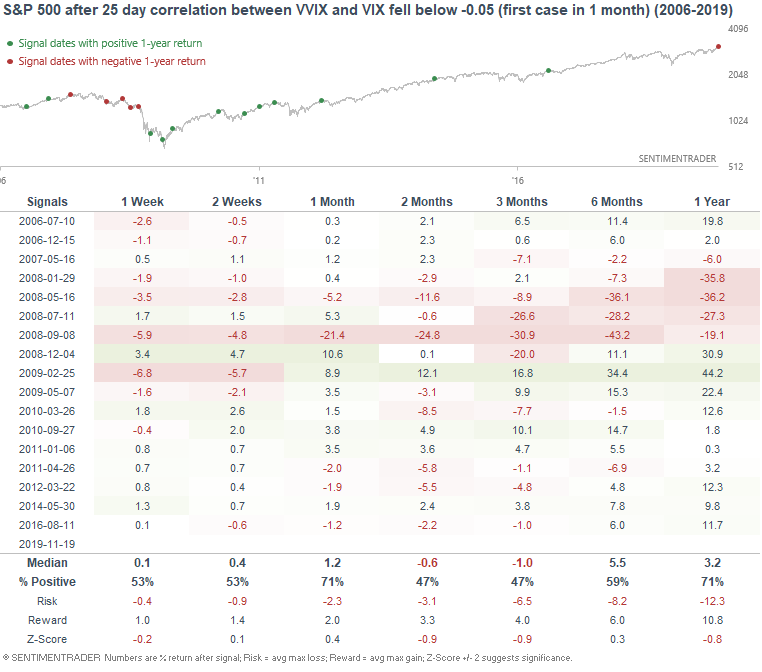
The following table illustrates what happened next to the S&P 500 when the 25 day correlation fell below -0.05.

As you can see, the S&P 500 often struggled over the next 3-6 months, with the most notable exceptions being during the initial recovery from the financial crisis.
We also looked at:
- The S&P's streak above its 10-day average
- How many days the S&P has been above average in 2019, one of the most in history
- Testing a sentiment/breadth composite
- The ratio of discretionary to technology stocks is oversold
- Few energy stocks are above their 200-day average relative to the rest of the market
- The Index Put/Call Ratio has spiked

