A 40-Year Record Super Trend for the Most Important Index
This has been a year for the record books, as we've seen from several different perspectives lately. We can add to that the length of super-strong trends in both the S&P 500 and Dow Industrials.
The S&P has been more than 8% above its 200-day moving average since last fall.
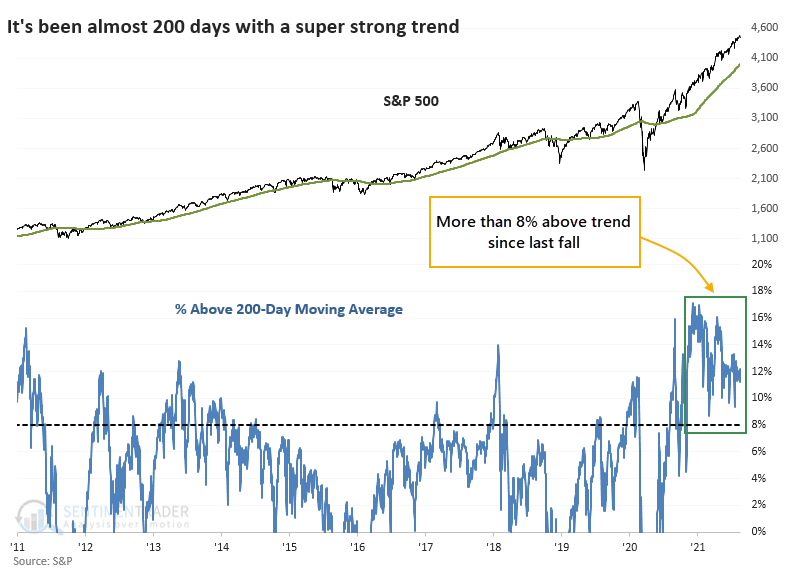
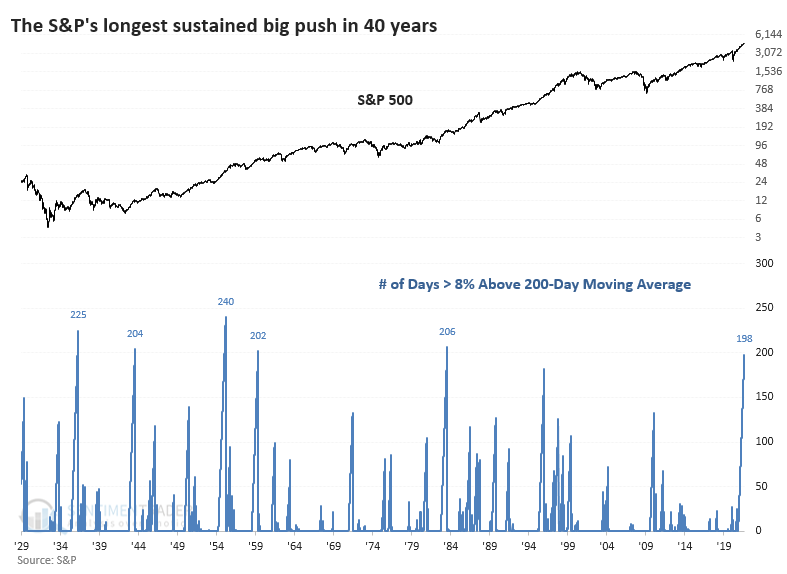
At nearly 200 consecutive trading days this far above trend, the current streak ranks among the best in the S&P's history and the longest in 40 years.
The Dow hasn't been quite as strong, holding "only" 6% above its long-term moving average. Even the momentum market of 2017 couldn't match this. This ranks among the longest super-strong trends in 120 years.
What else we're looking at
- Full returns in the S&P 500 after the current length of a super-strong trend
- How the Dow performed after a streak like its current run
- Why this year's drawdown in the S&P 500 has few precedents
- An in-depth view of leading economic indicators around the world and what it says about future returns
- One country's performance after moves in central bank rates
| Stat box On Wednesday, the S&P 500 fund, SPY, lost more than 1%. Of the 10 other times it suffered a 1% or greater loss in 2021, it showed a positive return by 10 days later every time, averaging 3.7%, so traders should watch for a change in character with the latest one. |
Etcetera
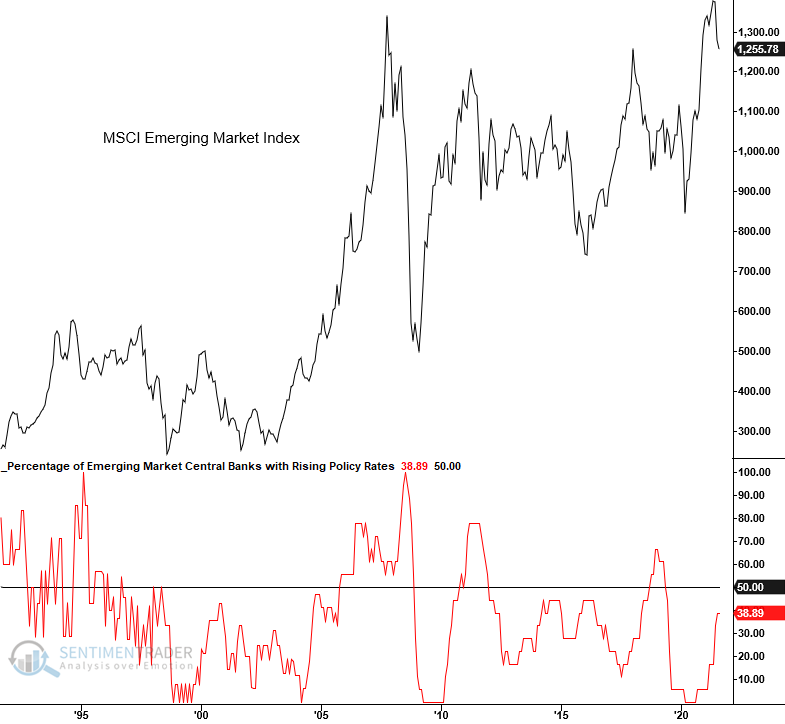
Rising rates. Among emerging market countries, Dean shows that 39% of them now have central banks that have increased their target interest rate.
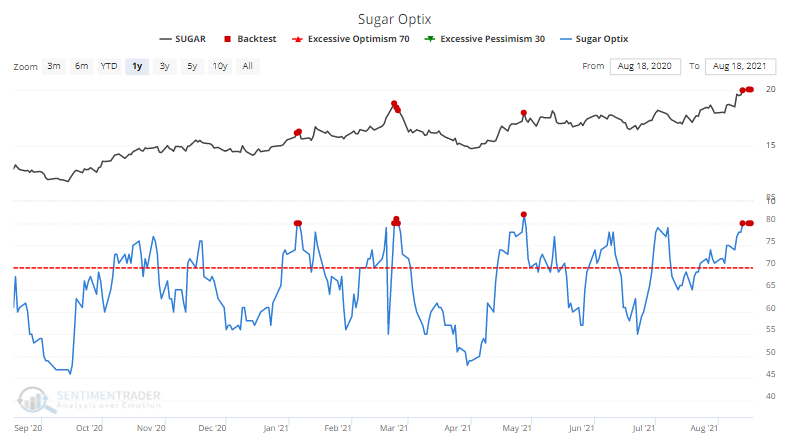
Sugar high. Our Optimism Index on sugar is among the highest of any commodity. Over the past year, readings of 80% or higher have not been kind to the contract.
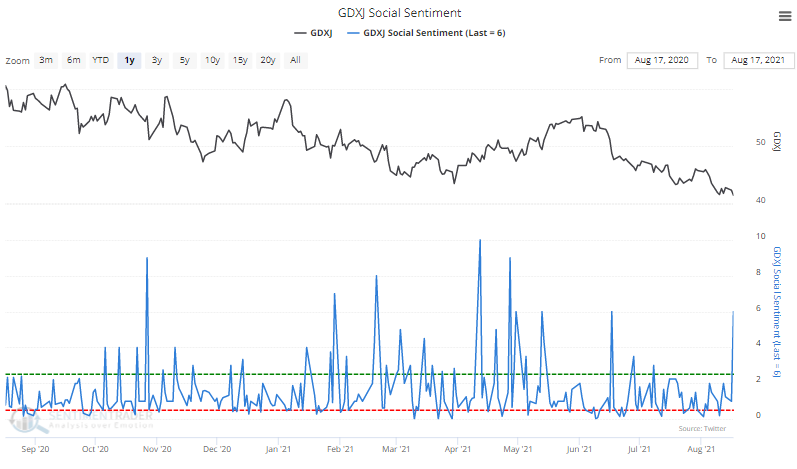
Major spike in Junior pessimism. Twitter users had 6 times more negative things to say than positive things on junior gold mining stocks this week.
