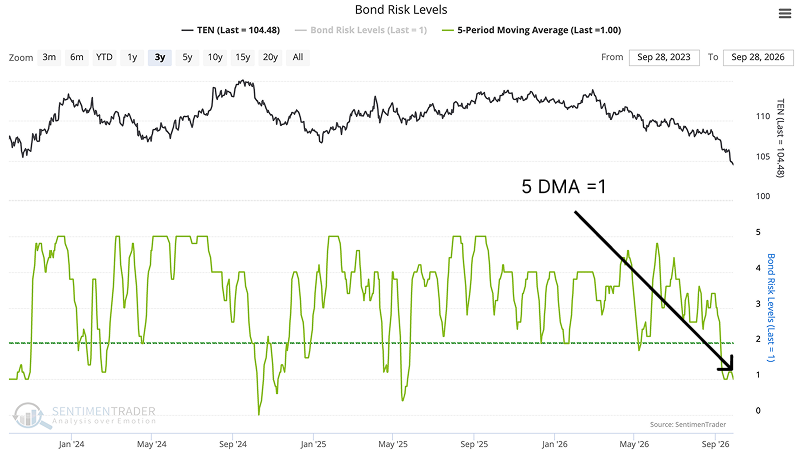
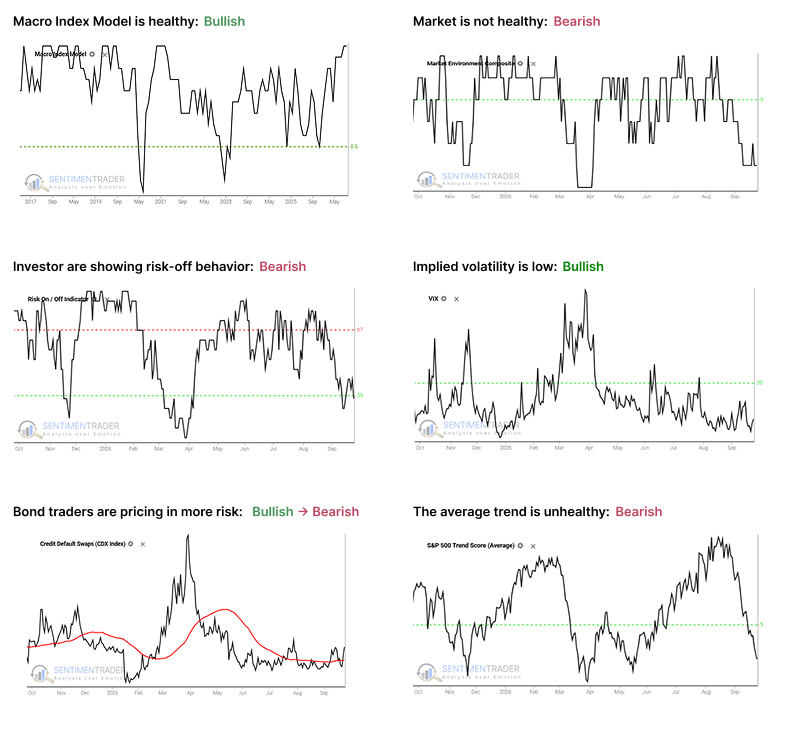
Bond Risk Levels' 5-day average has returned to 1. Similar episodes brought weaker average SPX returns and deeper early drawdowns, but six-month outcomes converged toward ordinary periods and the 10-year Treasury record remained mixed.
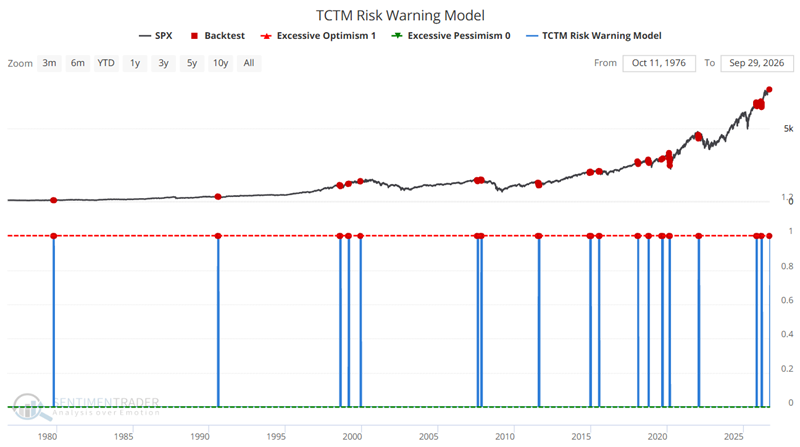
The TCTM Risk Warning Model has triggered a warning signal for the first time since just prior to the sell off in March of this year. We detail the history of this signal and the near-term implications herein.
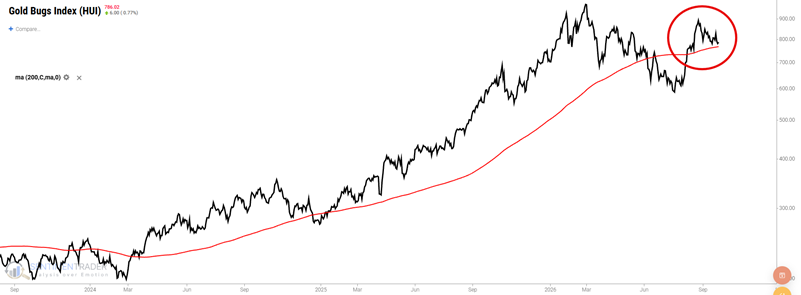
Gold mining stocks have spent the last six months consolidating after soaring almost 250% from December 2024 to March 2026. Some traders may see the latest pullback as a buying opportunity. However, the history of gold miners strongly suggests holding off a little longer. Details inside.
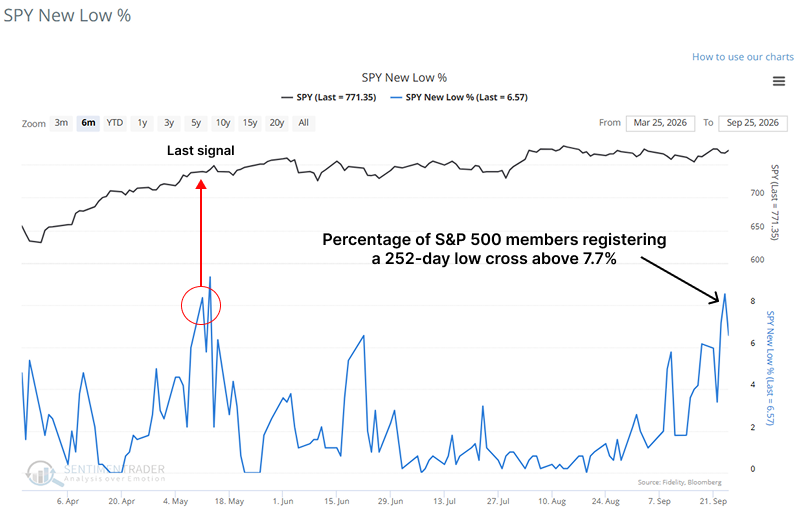
The S&P 500 New Low Spike Model triggered as 52-week new lows cross 7.7% near market highs. With S-TCTM Composite Risk Warning preconditions met and oil-driven inflation fears looming, historical data signals elevated 1-month correction risk.
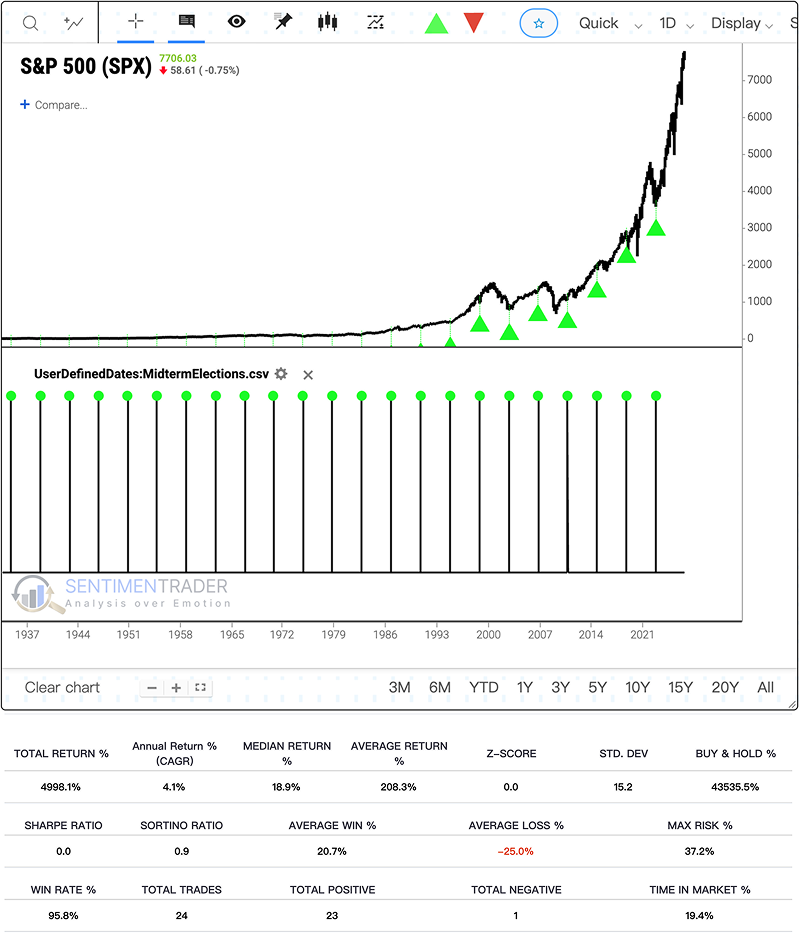
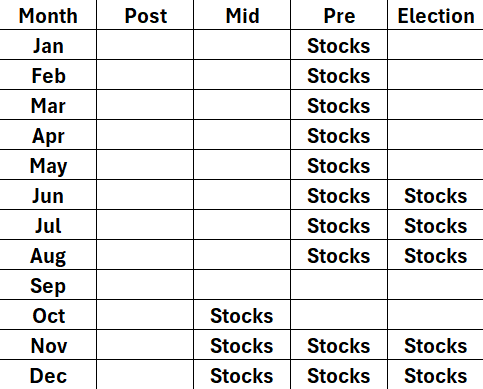
Despite short-term breadth deterioration and surging Treasury yields, the S&P 500 is about to enter its most historically bullish 11-month midterm election window, boasting a flawless win rate for 200-day holds since 1934.
Midterm years have historically outperformed other presidential-cycle years after a late-September S&P 500 entry. The advantage appeared before election day and survived nearby entry dates, but 1930 and the deep 2018 drawdown show why a high win rate does not mean low risk.
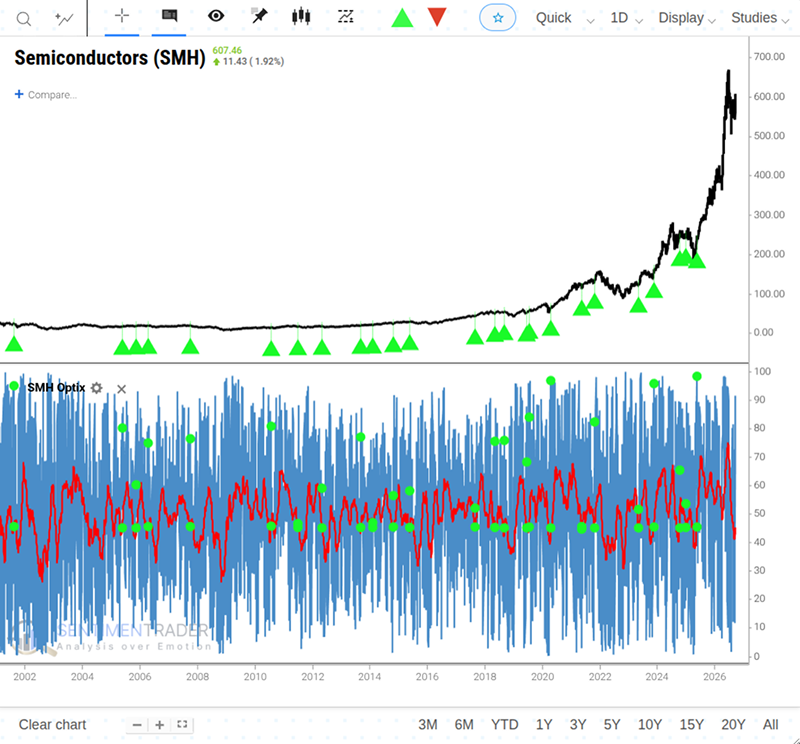
The VanEck Semiconductor ETF ($SMH) has rebounded strongly, with a bullish Optix signal boasting a 76% 1-week win rate. However, history shows waiting one month for price confirmation pushes the subsequent 1-month win rate to a massive 93%.
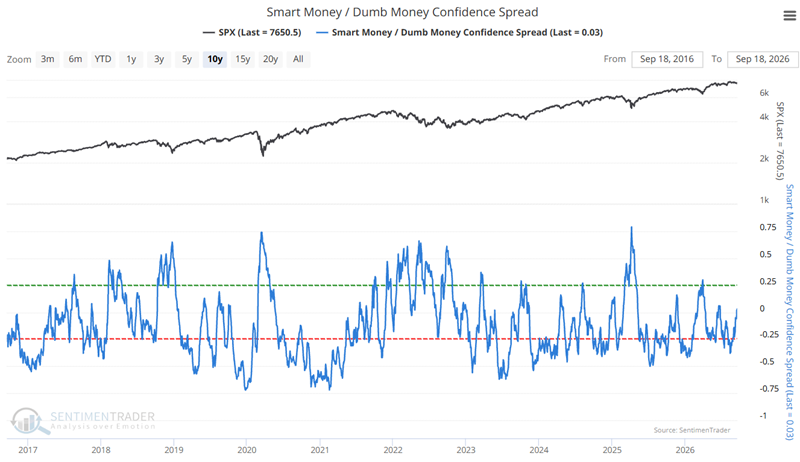
The Smart Money/Dumb Money Confidence Spread is an important sentiment indicator. In this note, we test a systematic approach in Backtest Engine 2.0 using a recently triggered entry signal with exit criteria added.