
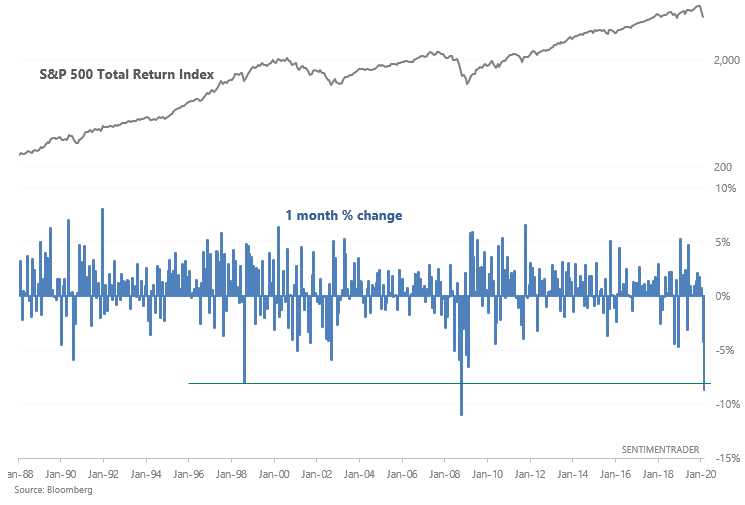
60/40 portfolio has been hammered
Although this month isn't over, March has been brutal for investors. Stocks got hammered and corporate bonds have as well. A model 60/40 portfolio, which tilts 60% towards the S&P 500 Total Return Index and 40% towards the Bloomberg Barclays U.S. Aggregate Bond Index, saw a 1 month % change that can only be compared to 2008 and 1998:
Both of those historical cases saw the S&P 500 rally over the next year:
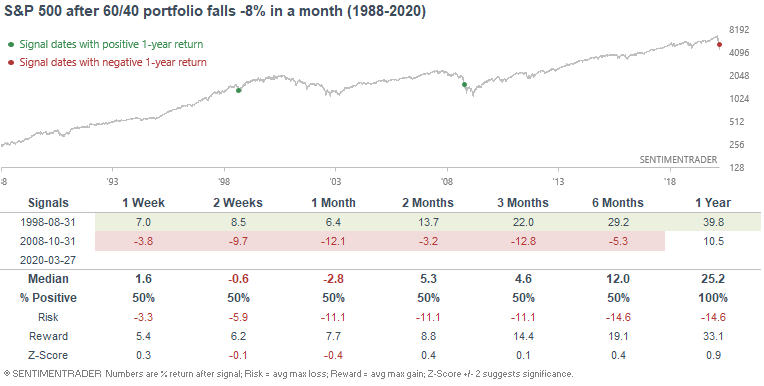
Since Bloomberg's historical data for the S&P 500 Total Return Index only goes back to 1988, 1987 certainly would have been included in this sample set. Once again, stocks rallied significantly 1 year after the October 1987 market crash.