Data &
Technology
Research
Reports
Report Solutions
Reports Library
Actionable
Strategies
Free
Resources
Simple Backtest Calculator
Simple Seasonality Calculator
The Kelly Criterion Calculator
Sentiment Geo Map
Public Research Reports
Free Webinar
Pricing
Company
About
Meet Our Team
In the News
Testimonials
Client Success Stories
Contact
Log inLoginSign up
< BACK TO ALL REPORTS

6 signs of the coming apocalypse

Jason Goepfert
2020-12-07
Warnings by a widely-followed money manager and a major business publication highlight potential risks for stocks ahead.

Stock prices are stretched, their valuations are absurd, and investors are all-in.

So notes money manager John Hussman in a recent post outlining the dangers that investors are currently facing. As he states:

"The red bars in the chart below show one of the more extreme syndromes of “overvalued, overbought, overbullish” conditions one can define. The specific conditions are shown in the chart text. The bars with yellow shading show instances where this syndrome has been in place, and the S&P 500 dropped at least 7% over the following month. All of these instances, prior to those of the past few days, are shaded yellow."

john hussman warning

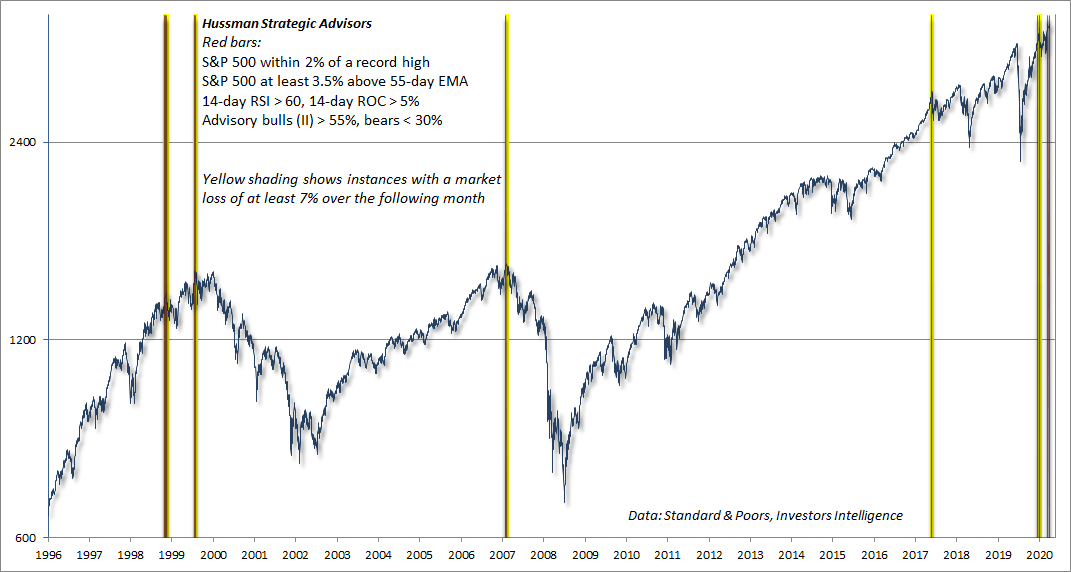
Regarding his latest warning, the criteria that have preceded big declines include:

  1. The S&P 500 is within 2% of a 52-week high
  2. It is at least 3.5% above its 55-day exponential moving average
  3. Its 14-day Relative Strength Index is > 60%
  4. Its 14-day rate of change is > 5%
  5. Investor's Intelligence survey bulls are > 55%
  6. Investor's Intelligence survey bears are < 30%

We should all be immediately triggered by the use of super-specific conditions and a lot of them. Regardless, if we look objectively at every instance when all of these criteria were met, then we can see that the S&P 500's forward returns were better than random across most time frames.


What else is happening

These are topics we explored in our most recent research. For immediate access with no obligation, sign up for a 30-day free trial now.

  • S&P 500 returns following all Hussman "triple O" warning signs
  • Forward returns after 5 warning signs outlined by Bloomberg, too

Stat Box

As of Friday, 8 out of the 9 major sectors, as represented by the popular iShares sector funds, saw more than 80% of their stocks trading above their 200-day moving averages. The only outlier was XLU (utilities) where "only" 75% of stocks were in uptrends.

Sentiment from other perspectives

We don't necessarily agree with everything posted here - some of our work might directly contradict it - but it's often worth knowing what others are watching.

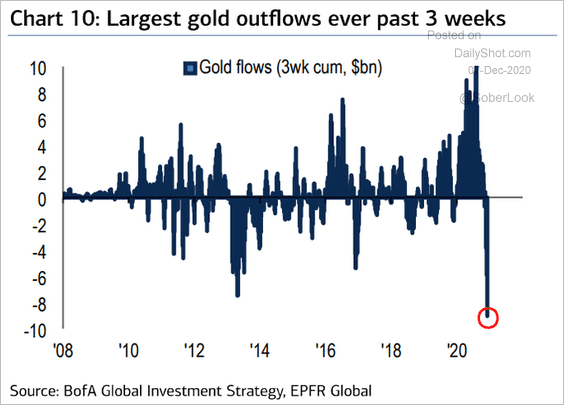
1. With traders all in a dither over bitcoin, the demand for "other money" has shifted from gold. As money poured into bits and bytes, it flowed out of gold funds. [Bank of America via Daily Shot]

gold etf flow

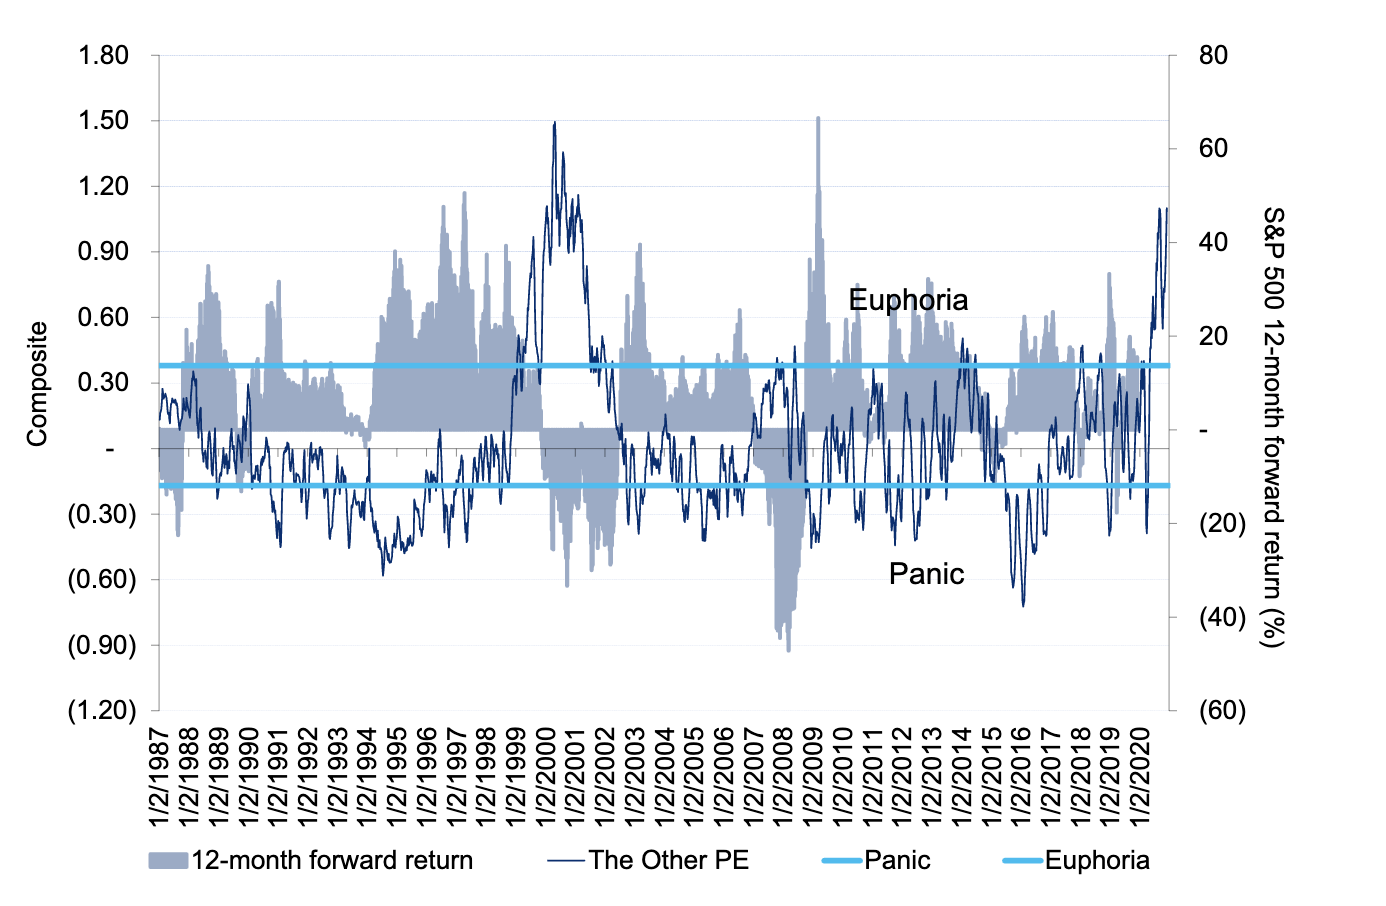
2. Citi's sentiment model has become stretched and is well into the euphoric stage, which has preceded below-average returns. [Bloomberg]

citi panic euphoria sentiment model

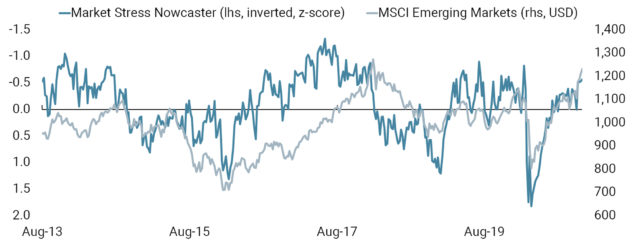
3. Emerging markets have been among the biggest beneficiaries of improving sentiment over the past 2 months, and we can thank a lessening of market stress in those markets for that sentiment shift. [Unigestion]

emerging market stress

DATA &
TECHnologies
IndicatorEdge
‍
BackTestEdge
‍
Other Tools
‍
DataEdge API
RESEARCH
reports
Research Solution
‍
Reports Library
‍
actionable
Strategies
Trading Strategies
‍
Smart Stock Scanner
‍
FREE
RESOUrCES
Simple Backtest
Calculator
Simple Seasonality
Calculator
The Kelly Criterion
Calculator
Sentiment Geo Map
‍
Public Research Reports
‍
Free Webinar
COMPANY
‍
About
‍
Meet our Team
‍
In the News
‍
Testimonials
‍
Client Success Stories
Pricing
Bundle pricing
‍
Announcements
‍
FAQ
© 2024 Sundial Capital Research Inc. All rights reserved.
Setsail Marketing
TermsPrivacyAffiliate Program
Risk Disclosure: Futures and forex trading contains substantial risk and is not for every investor. An investor could potentially lose all or more than the initial investment. Risk capital is money that can be lost without jeopardizing ones’ financial security or life style. Only risk capital should be used for trading and only those with sufficient risk capital should consider trading. Past performance is not necessarily indicative of future results.

Hypothetical Performance Disclosure: Hypothetical performance results have many inherent limitations, some of which are described below. No representation is being made that any account will or is likely to achieve profits or losses similar to those shown; in fact, there are frequently sharp differences between hypothetical performance results and the actual results subsequently achieved by any particular trading program. One of the limitations of hypothetical performance results is that they are generally prepared with the benefit of hindsight. In addition, hypothetical trading does not involve financial risk, and no hypothetical trading record can completely account for the impact of financial risk of actual trading. for example, the ability to withstand losses or to adhere to a particular trading program in spite of trading losses are material points which can also adversely affect actual trading results. There are numerous other factors related to the markets in general or to the implementation of any specific trading program which cannot be fully accounted for in the preparation of hypothetical performance results and all which can adversely affect trading results.

Testimonial Disclosure: Testimonials appearing on this website may not be representative of other clients or customers and is not a guarantee of future performance or success.