
3 stumbles after the FOMC

3 stumbles after the FOMC
After a significant FOMC decision day stock surge, the hawkish pivot by the fed settled in, and traders sold stocks, with the S&P 500 suffering 3 consecutive negative days of 0.75% or more. Dean assessed the outlook for the S&P 500 when the index closes down for 3 successive days post an FOMC decision day.
That signal triggered 22 other times over the past 31 years. With the S&P 500 down 0.87%, 1.03%, and 1.14% respectively on Thursday, Friday, and Monday, Dean also looked at historical instances when the S&P 500 closes down 0.5% or more for three consecutive days post a decision day. This signal triggered 5 other times over the past 22 years. Stocks rallied each time after those.
Context is always essential when assessing historical patterns. So, Dean evaluated the outlook for the 3 consecutive down days after an FOMC decision day when Federal Reserve policy is easy or tight. If the Fed funds interest rate count is greater than 0, the policy is considered tight. Conversely, if the count is below 0, the policy is deemed to be easy. As it stands now, Fed policy remains easy even though the Fed has signaled that they would like to move to a less friendly stance.
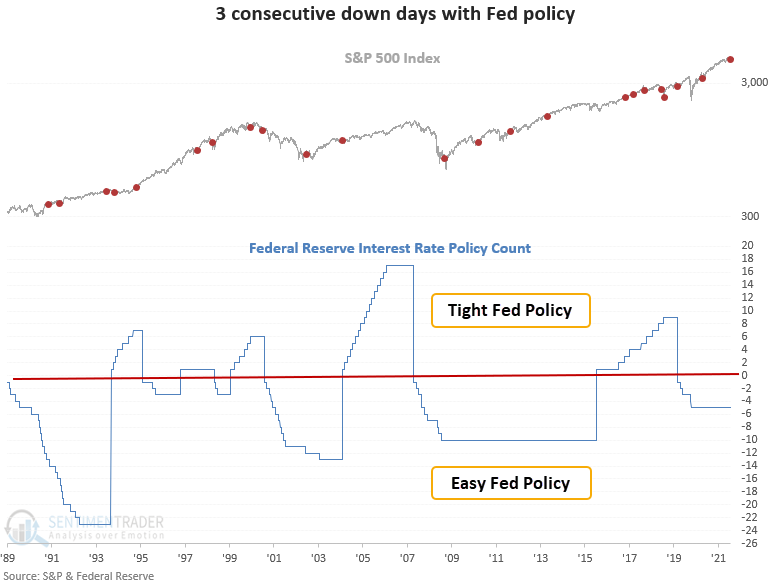
This signal triggered 10 other times over the past 31 years. After the others, future returns and win rates were excellent across all time frames, with several significant z-scores. Fed policy matters.

| Stat box The CurrencyShares Euro Trust (FXE) is working on its 7th consecutive monthly decline. Over the past 15 years, it reached 7 consecutive down months in June 2010 and 9 months in March 2015. |
Nasdaq's volatile December leads to overwhelming number of losers
We saw yesterday that there is a historic spread between stocks in medium-term uptrends in Consumer Staples versus those traded on the Nasdaq exchange.
Among the latter, there has been significant damage. Over the past 20 days, the spread between 52-week highs and lows has dropped to -7% of all issues. Fewer than 3% of days in 25 years have recorded a lower reading than what we see now.
Forward returns for the Nasdaq were excellent after the other signals, with one major exception.
All of this has occurred during one of the most volatile Decembers ever. Through the first 15 days of the month, the Nasdaq Composite has swung an average of more than 1.3% per day, the 8th most-volatile December in the index's history.
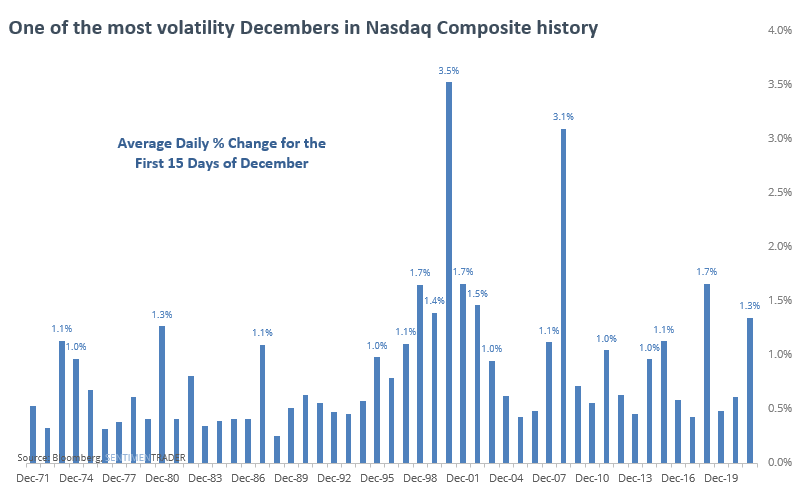
Other volatile Decembers tended to see the Nasdaq rebound into the new year, though it didn't say much for the index's prospects beyond that.
