Products
SentimenTrader Trading Tools
‍
Backtest Engine
My Trading Toolkit
Correlation Analysis
Seasonality
Market Prediction
Indicators & Data API
‍
Proprietary Indicators & Charts
Market Data API
Strategies & Scanner
‍
50+ Trading Strategies
Smart Stock Scanner
Smart Option Scanner
Research Reports
‍
Research Solutions
Reports Library
Free Resources
Simple Backtest Calculator
Simple Seasonality Calculator
The Kelly Criterion Calculator
Sentiment Geo Map
Public Research Reports
Education
Sentiment Indicators
Technical Indicators
Pricing
Company
About
In the News
Testimonials
Client Success Stories
Contact
Log inLoginSign up
< BACK TO ALL REPORTS

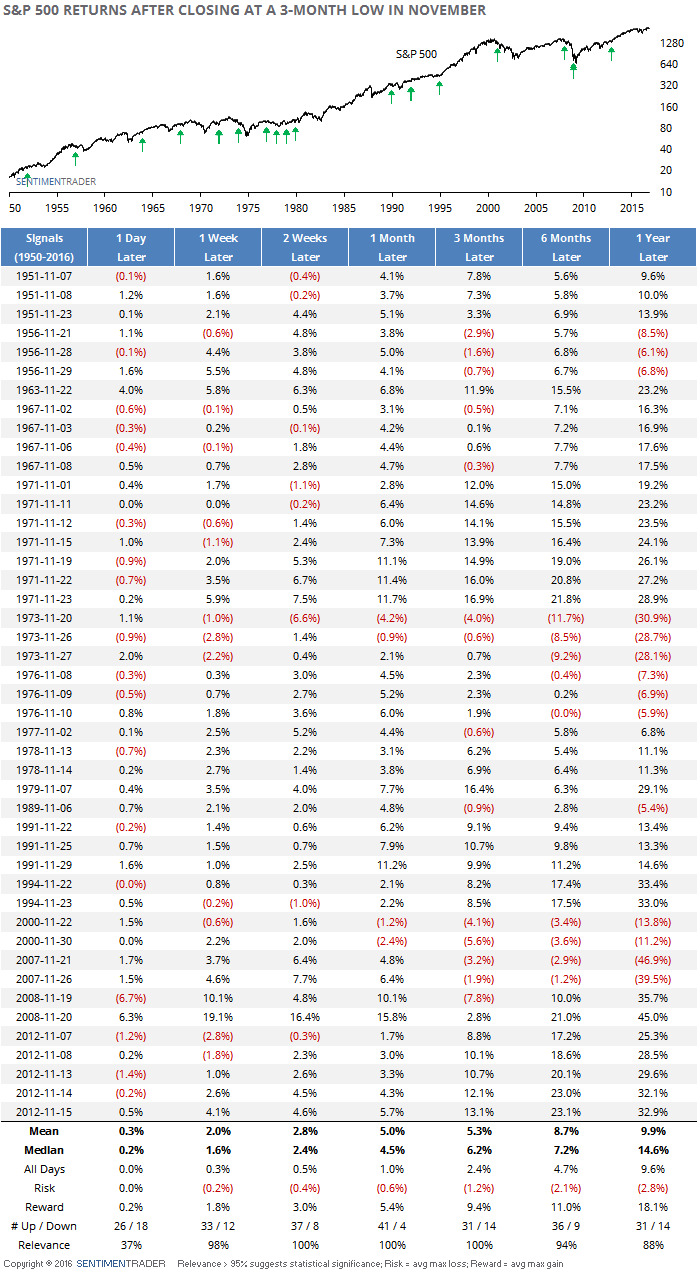
3-Month Lows In November

Jason Goepfert
2016-11-01
null

As stocks continue to sell off into the afternoon, the S&P 500 is in danger of doing something it hasn't done in four years - close at a multi-month low in November.

Most of us have heard about how November through April is the most seasonally positive time of the year, and we're already passed the scary September/October time frame. So multi-month lows in November are relatively rare.

Since 1950, the S&P has closed at a 3-month low on any day in November 45 times, including consecutive days. Remarkably, the S&P rebounded over the next month after 41 of those occurrences, with a nearly 10-to-1 reward-to-risk ratio. All dates are shown below.

20161101_spx

If you look at the recent dates, something else sticks out - most of them were election years. Here's the same table, but filtered for election years.

20161101_spx_election

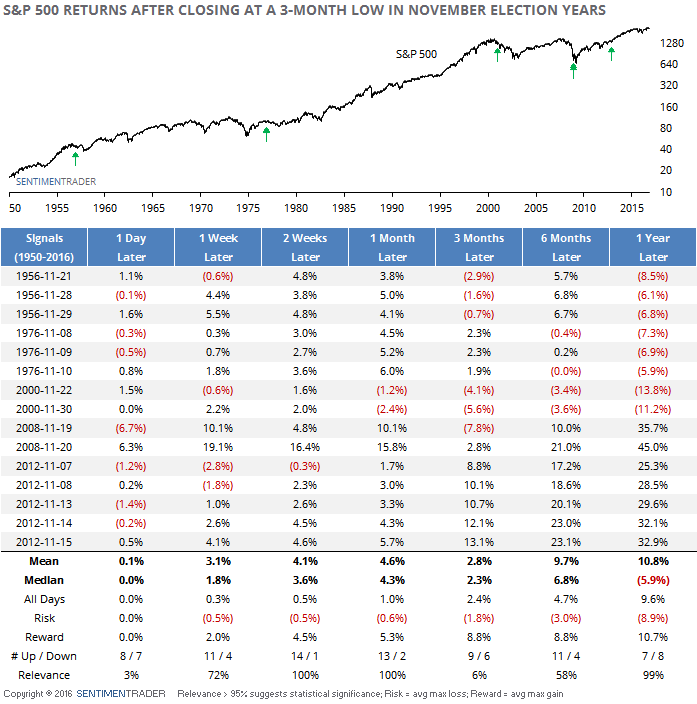
Over the next couple of weeks, the S&P rebounded after 14 of the 15 dates, though most of these occurred AFTER the election and not the week before.

It's also rare to see volatility increase like this at this point in the year. The VIX has jumped 30% or more in a week during November only four other times (1991-11-15, 2007-11-07, 2008-11-20, and 2015-11-13), all leading to rebounds over the next month.

It's anyone's guess how the next week is going to unfold with rapidly changing polling numbers. The probability seems high the volatility will remain elevated with high risk in stocks, both ways. But once the initial wave of uncertainty is passed after the election, we'd be looking at weakness as an opportunity to finally add back some stock exposure.

PRODUCTS
SentimenTrader
Trading Tools
Indicators & Data API
‍
Strategies & Scanner
‍
Research Reports
FREE
RESOUrCES
Simple Backtest
Calculator
Simple Seasonality
Calculator
The Kelly Criterion
Calculator
Sentiment Geo Map
‍
Public Research Reports
‍
Education
Sentiment Indicators
‍
Technical Indicators
‍
Pricing
Bundle pricing
‍
FAQ
‍
Announcements
‍
COMPANY
‍
About
‍
In the News
‍
Testimonials
‍
Client Success Stories
CONTACT
‍
General Inquiries
‍
Media Inquiries
‍
Financial Professionals Inquiries
‍
© 2026 Sundial Capital Research Inc. All rights reserved.
Setsail Marketing
TermsPrivacyAffiliate Program
Risk Disclosure: The information and tools provided are for research and analytical purposes only and are not intended as investment advice. Market analysis involves uncertainty, and outcomes may differ from expectations. Users should conduct their own due diligence and consider their individual circumstances before making any financial decisions. Past performance is not necessarily indicative of future results.

Hypothetical Performance Disclosure: Hypothetical performance results have many inherent limitations, some of which are described below. No representation is being made that any account will or is likely to achieve profits or losses similar to those shown; in fact, there are frequently sharp differences between hypothetical performance results and the actual results subsequently achieved by any particular trading program. One of the limitations of hypothetical performance results is that they are generally prepared with the benefit of hindsight. In addition, hypothetical trading does not involve financial risk, and no hypothetical trading record can completely account for the impact of financial risk of actual trading. for example, the ability to withstand losses or to adhere to a particular trading program in spite of trading losses are material points which can also adversely affect actual trading results. There are numerous other factors related to the markets in general or to the implementation of any specific trading program which cannot be fully accounted for in the preparation of hypothetical performance results and all which can adversely affect trading results.

Testimonial Disclosure: Testimonials appearing on this website may not be representative of other clients or customers and is not a guarantee of future performance or success.