252-Day Highs in Financials

When I was reviewing breadth indicators on an intraday basis this morning, I noticed that financial stocks dominated the new 252-day highs list. Financials are the most crucial sector to monitor when assessing market risk. I've shared several financial sector-based risk-off concepts that are components of the TCTM Risk Warning Model.
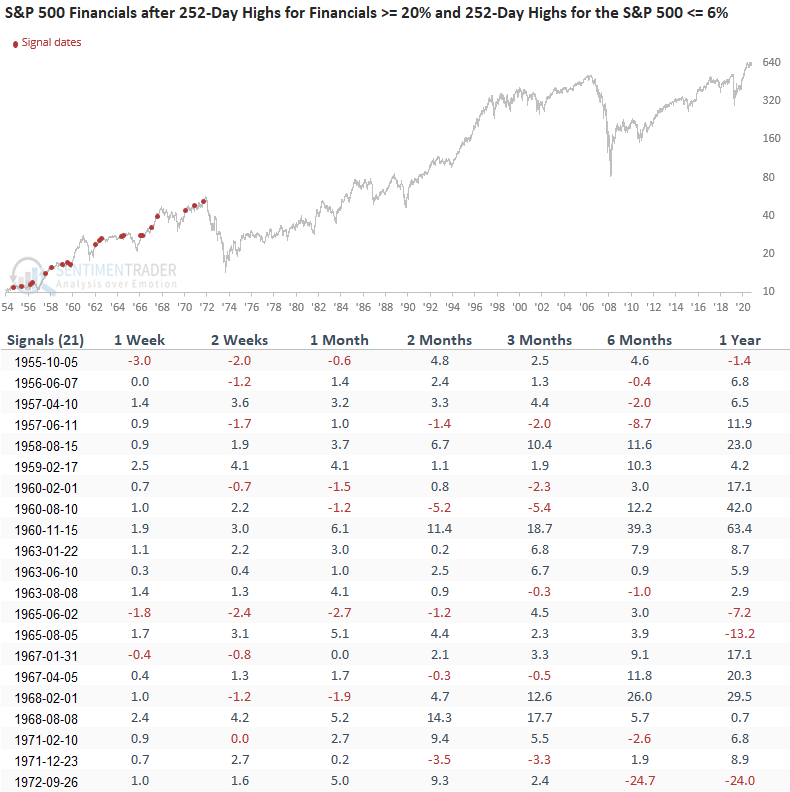
Let's conduct a study to assess whether the financial sector provides a bullish market outlook when the group dominates the new highs list.
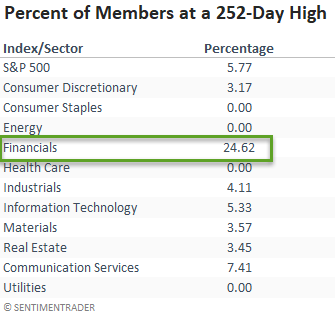
According to my intraday calculation, 24.62% of S&P 500 financial stocks were registering a 252-day high, while only 5.77% of S&P 500 members were at a high.
Our study will identify when greater than 20% of financial members register a 252-day, and less than 6% of S&P 500 members are at a 252-day high. And, I will require the S&P 500 Index to be trading down greater than 3%, but less than 10% from a 2-year high. The last condition will help to isolate instances similar to the current environment.
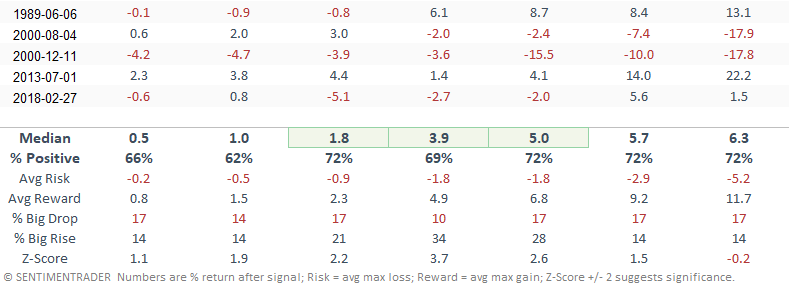
HOW THE SIGNALS PERFORMED
Results look really good, especially on an intermediate-term basis with several notable z-scores. However, you may notice that the last signal occurred in 1972.
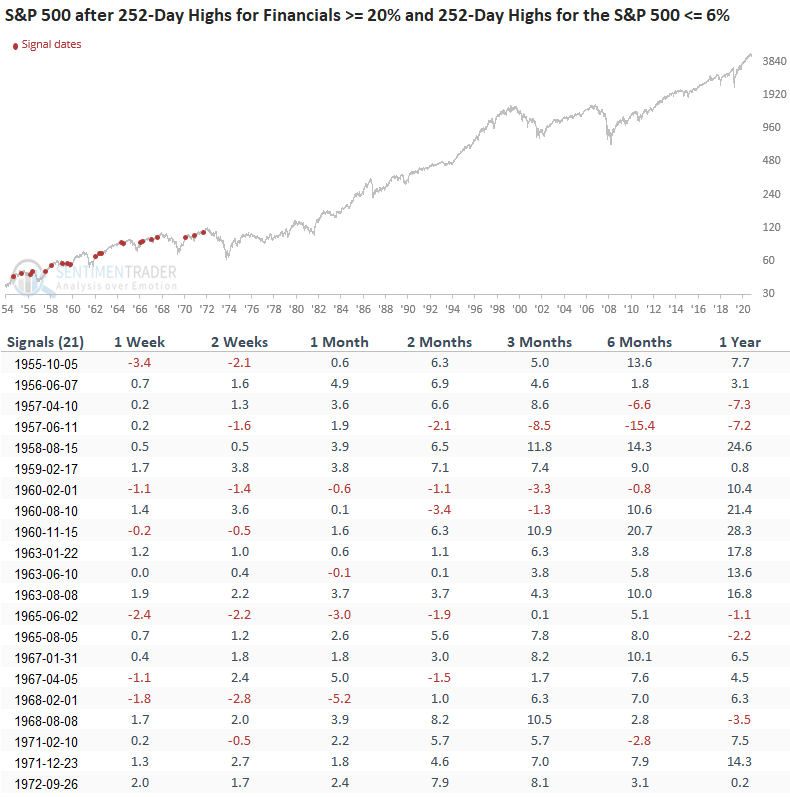
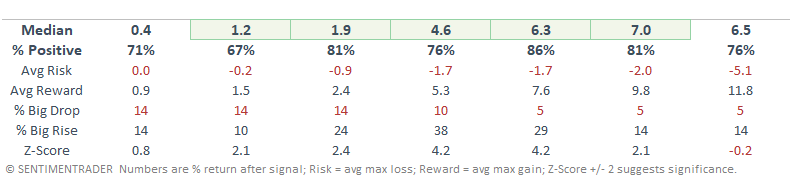
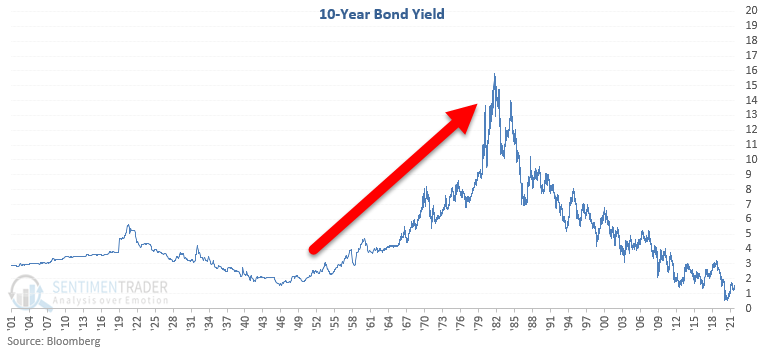
Interestingly, every single instance occurred during a secular bull market for yields.
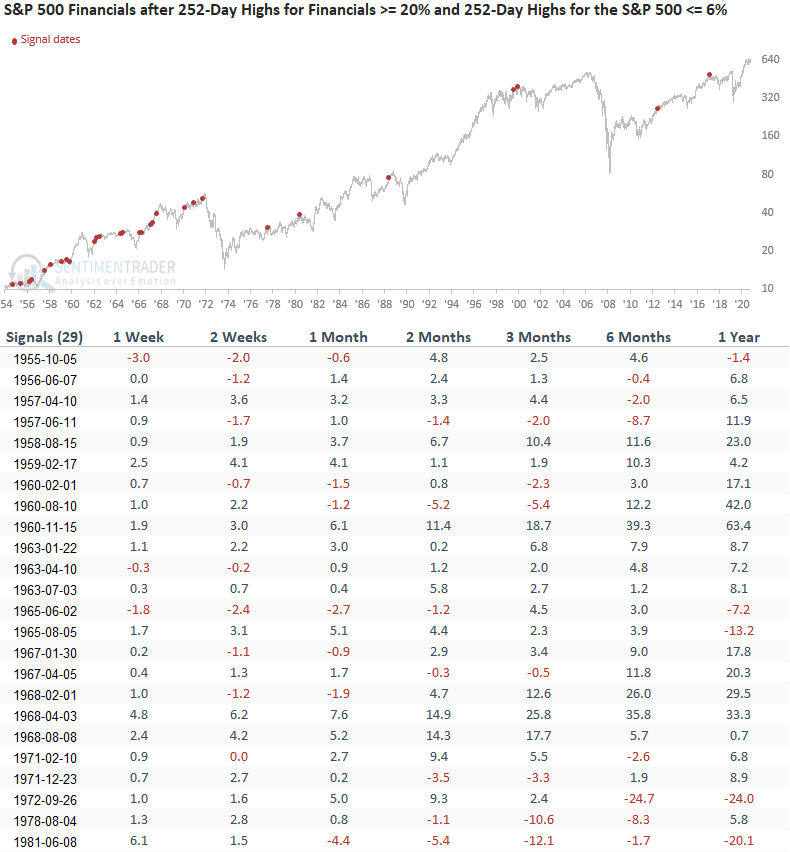
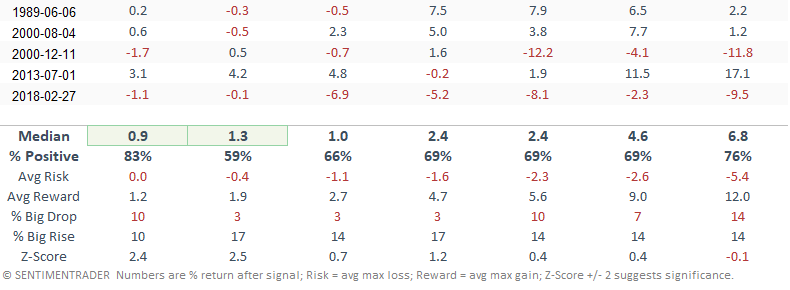
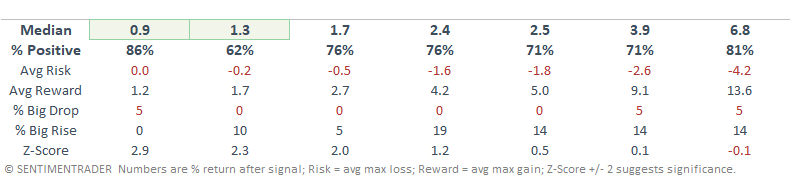
HOW THE SIGNALS PERFORMED - FINANCIALS
The results for the financial sector look good, especially the 1-week time frame. However, the S&P 500 data looks a little more robust.
Let's adjust our study parameters so we can potentially examine a larger sample size. I will now increase the percentage of S&P 500 members registering a 252-day high to 10%. All other inputs will remain the same.
HOW THE SIGNALS PERFORMED
By adjusting the S&P 500 parameter up to 10%, the study captured an additional seven signals. The new signals are a mixed bag and slightly devalue the overall results.

HOW THE SIGNALS PERFORMED - FINANCIALS
The short-term results continue to look good. As with the S&P 500, the new signals slightly devalue the intermediate to long-term outlook.