
252-Day High in the 10-Year Bond Yield

The 10-year yield registered a 252-day high on 2/25/21. This is the first occurrence since the last 252-day low on 8/4/20. Typically, rising interest rates reflect positive trends in the economy and operate with a lag on future growth. While the following analysis may be common knowledge, I think it's important to review the wide-ranging implications on the markets as the signals are rare.
Let's take a look at what happens to bonds, stocks, and commodities after a 252-day high in the 10-year yield with a 252-day low reset.
Interest Rate Comparison
The table below contains all instances when the 10-year yield registered a 252-day high after a 252-day low reset. i.e., the first occurrence. The new signal on 2/25/21 shows a 102 bps increase in the 10-year yield in a 139 trading day time span.
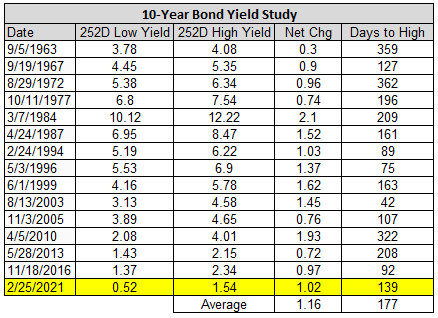
Source: St. Louis Fed, Department of the Treasury, Bloomberg, CRSP, S&P, and Sentimentrader.com
Please note, the numbers in the interest rate performance tables reflect the net change in yield.
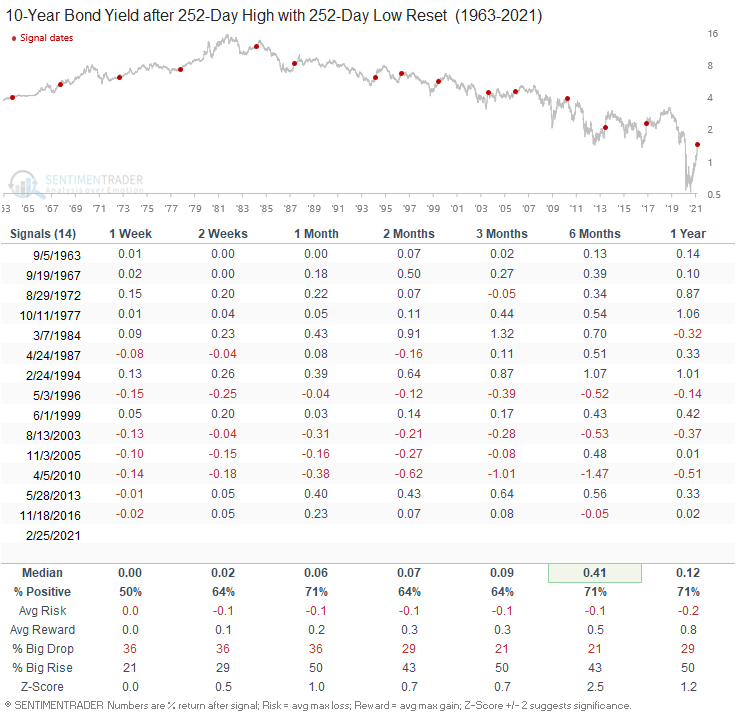
10-Year Bond Yield Performance
As the table below shows, the 10-year yield increased on a fairly consistent basis.
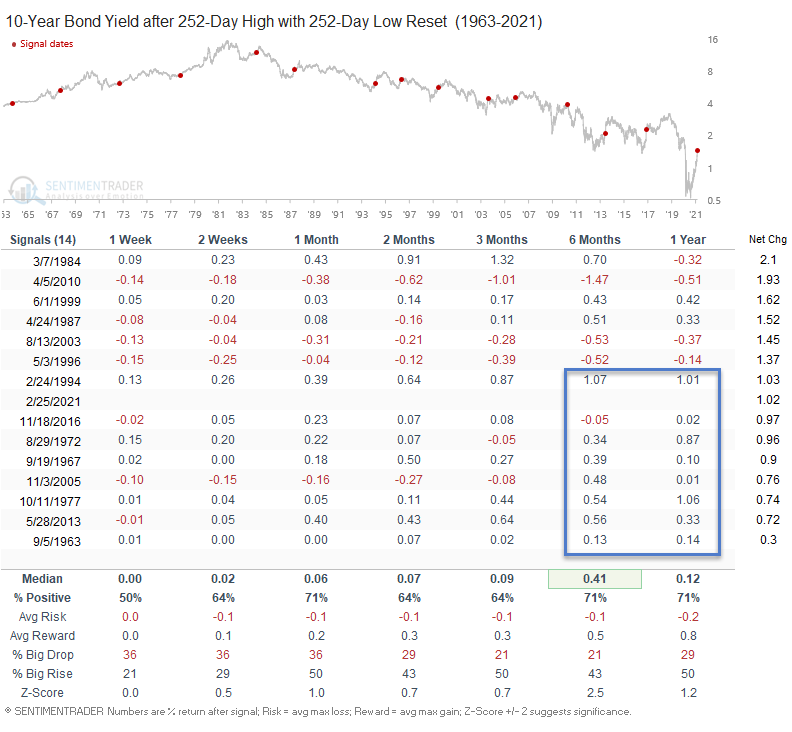
10-Year Bond Yield Performance with Net Change Sort (see last column for net change)
When I sort the performance table by the net change in the 10-year from the 252-day low to the 252-day high, one can see a greater tendency for the smaller basis point changes to exhibit more upside in yields over the next 6-12 months.
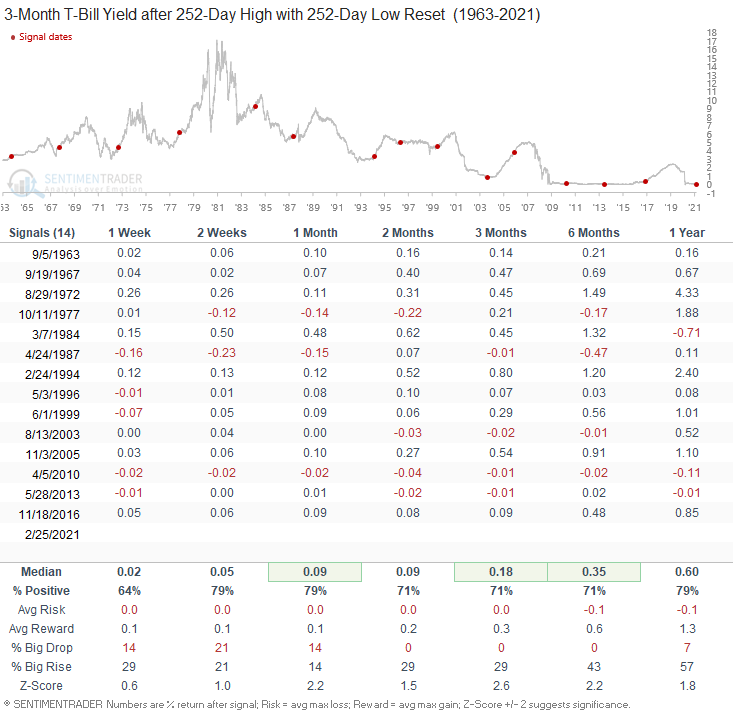
3-Month Bond Yield Performance
The 3-month T-Bill yield shows a consistent increase across all timeframes.
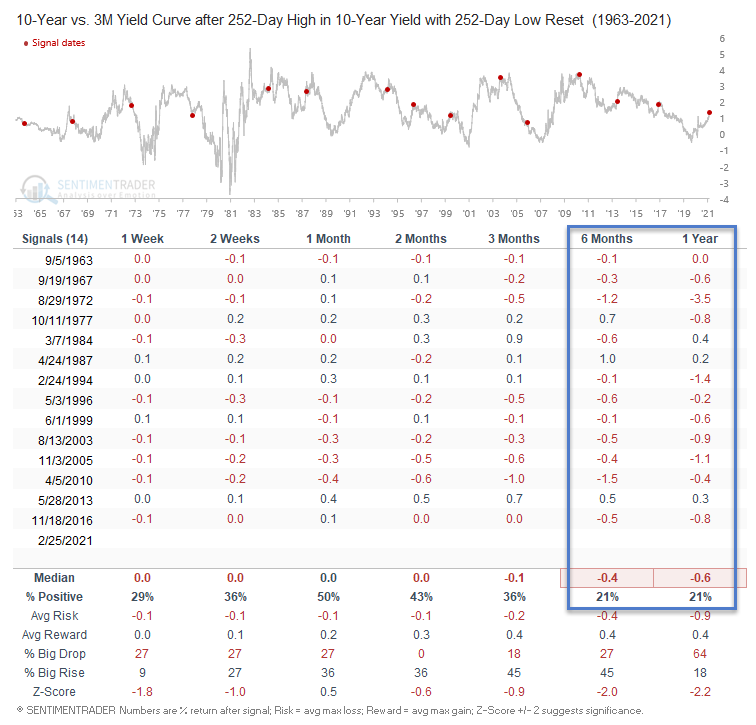
Yield Curve Performance - 10-Year vs. 3-Month Spread
The yield curve exhibits a strong tendency to flatten over the next 6-12 months.
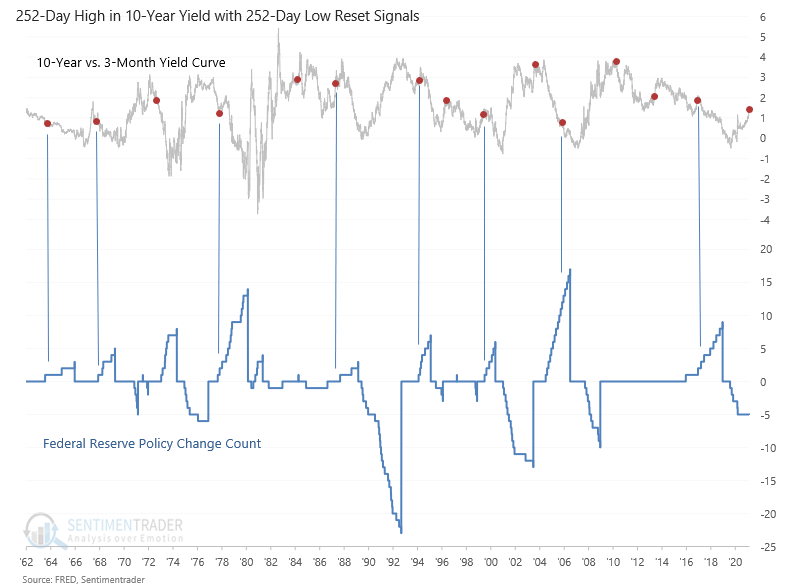
Yield Curve and Federal Reserve Policy
The following chart highlights how the yield curve's flattening can be attributed to federal reserve policy in a majority of instances. The federal reserve cycle count was rising in 8/14 cases.
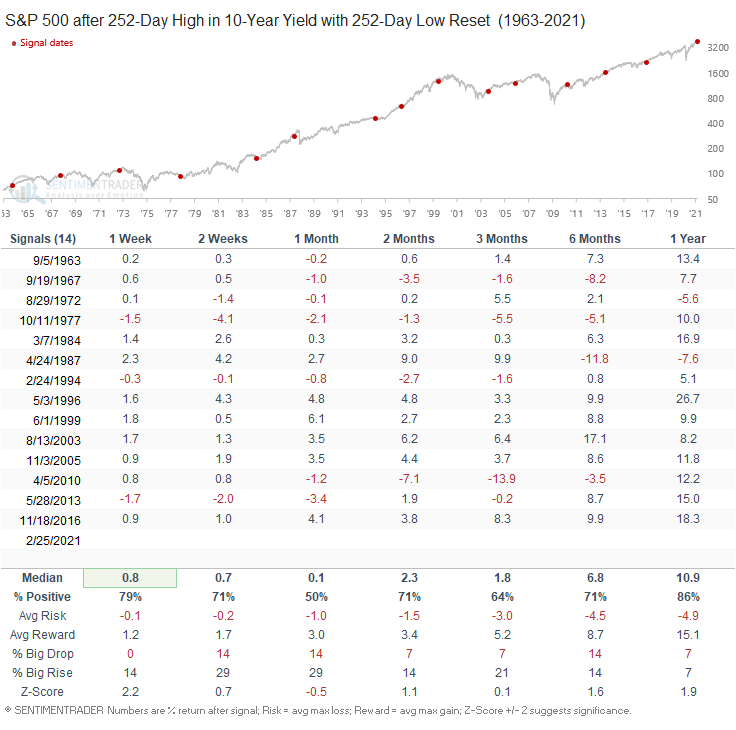
S&P 500 Index Performance
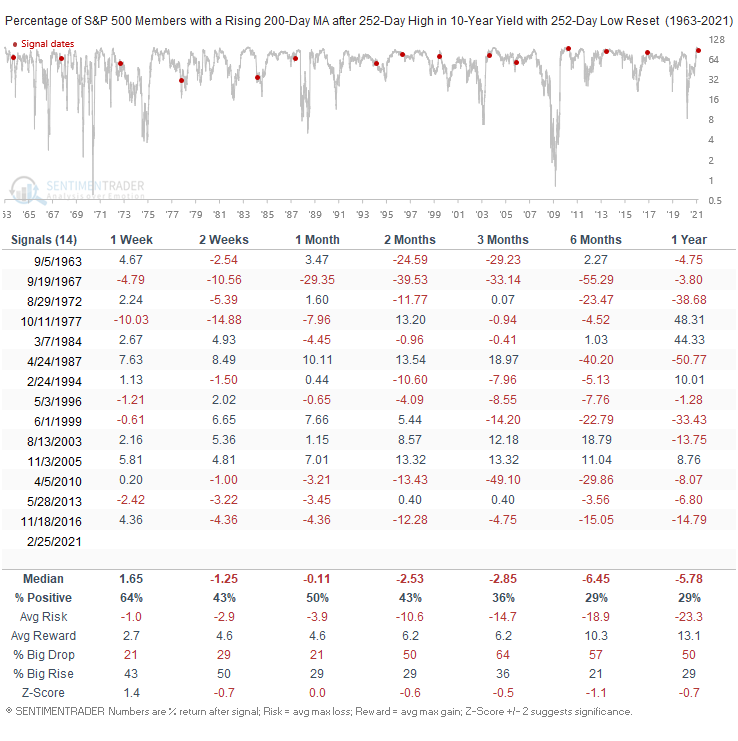
Large-Cap Market Breadth Performance
The percentage of S&P 500 members with a rising 200-day moving average weakened consistently. While most of the instances started from a high level, higher rates will impact certain industries.
Please note, the numbers in the breadth table reflect the net change in the percentage of members with a rising 200-day moving average.
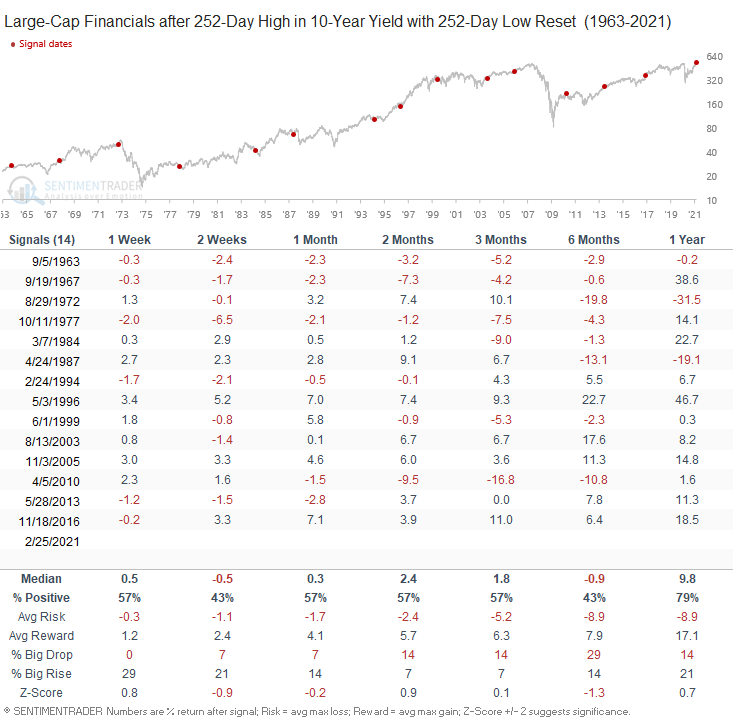
Large-Cap Financials Performance
Historically, financials are impacted by the flattening yield curve. One has to wonder if that will be the case anytime soon.
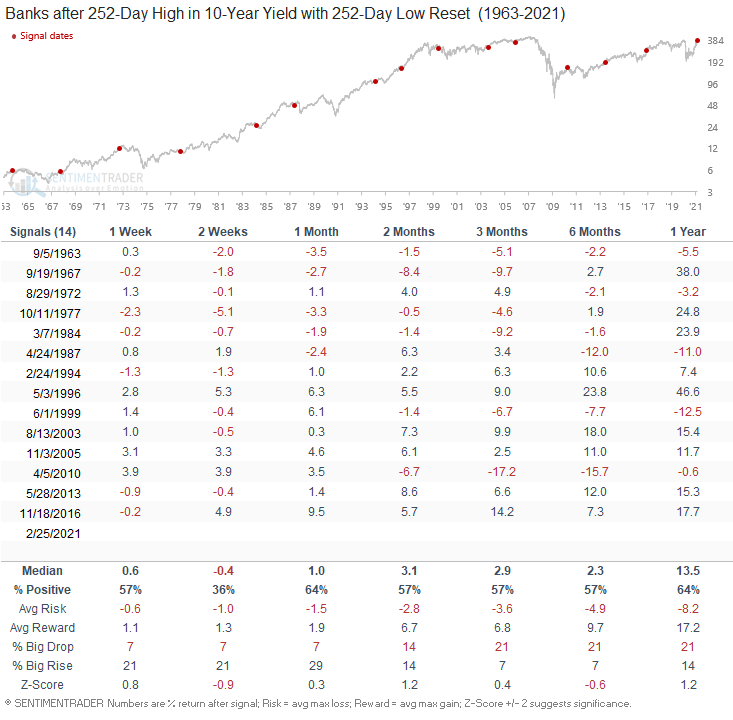
All-Cap Bank Performance
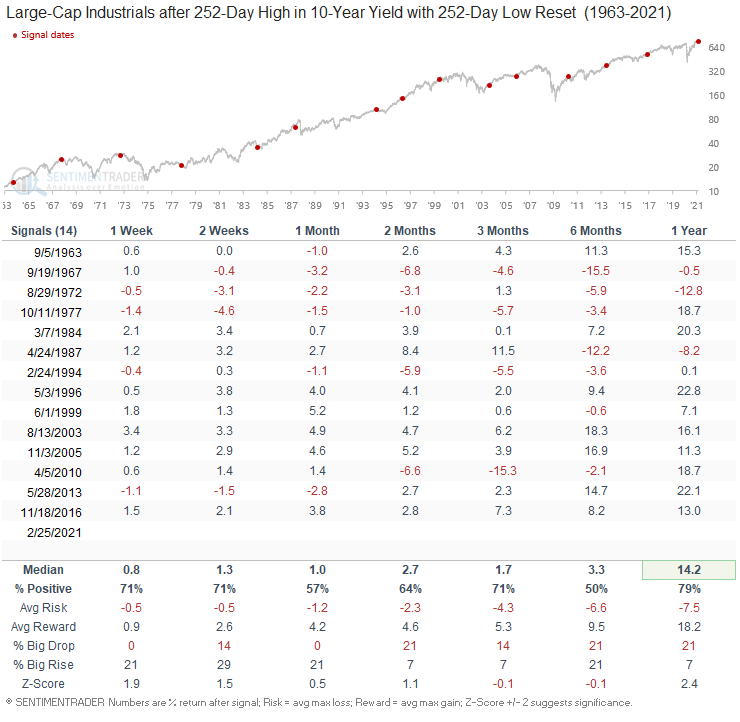
Large-Cap Industrials Performance
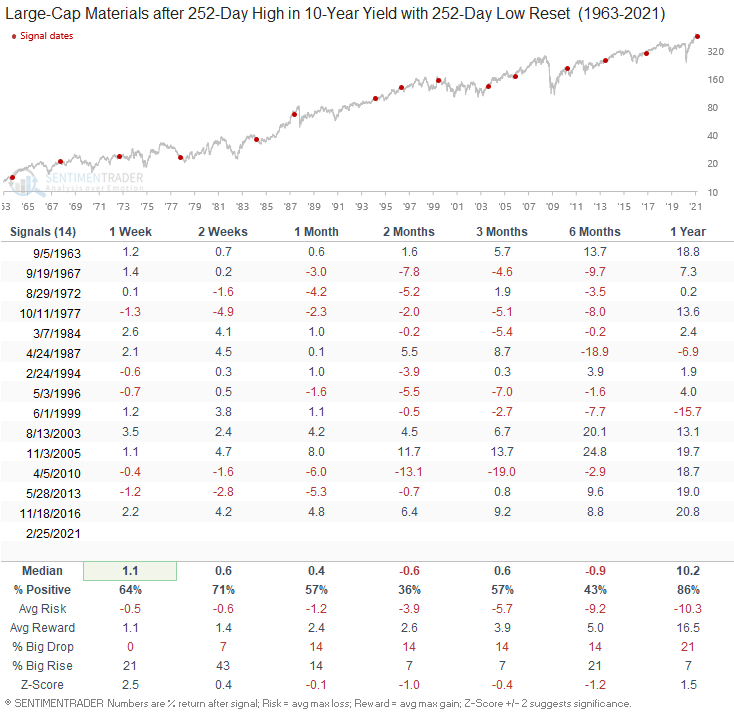
Large-Cap Materials Performance
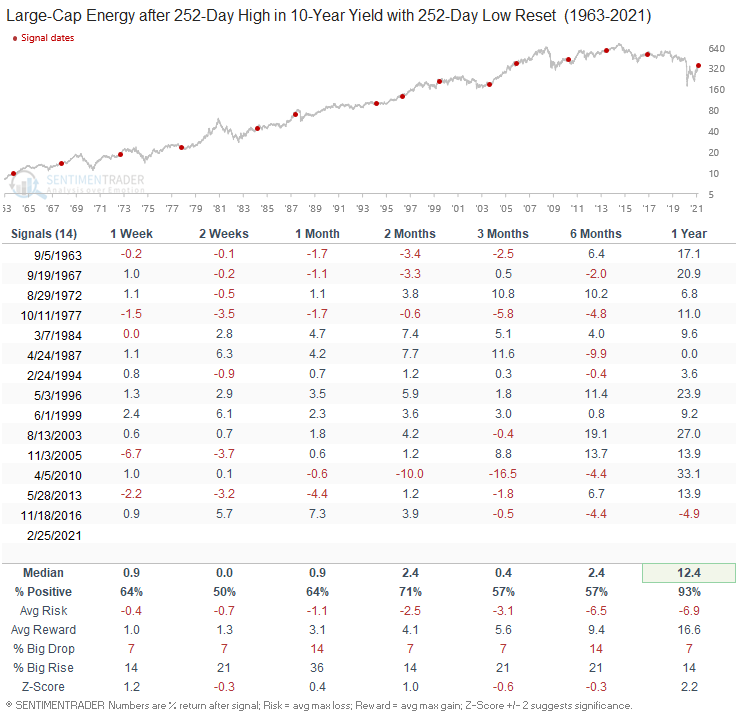
Large-Cap Energy Performance
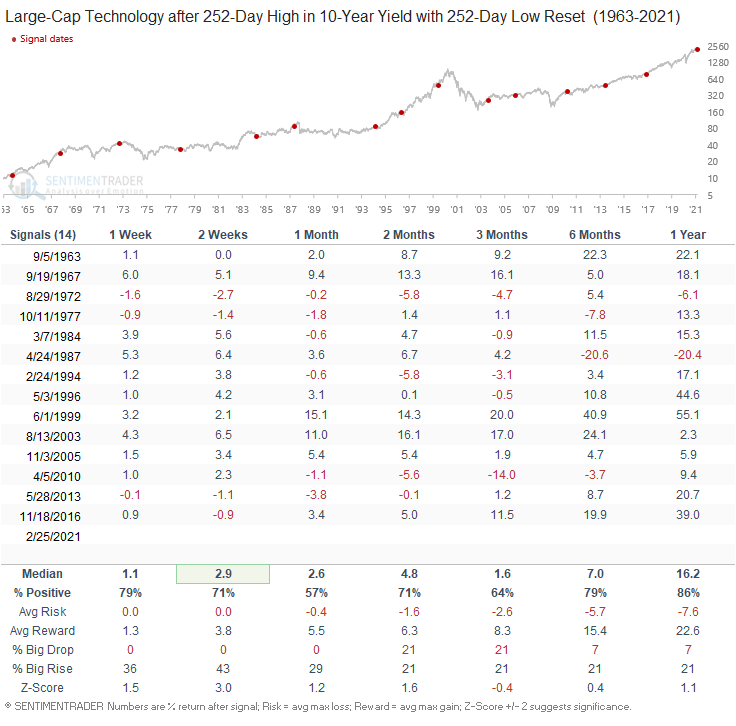
Large-Cap Technology Performance
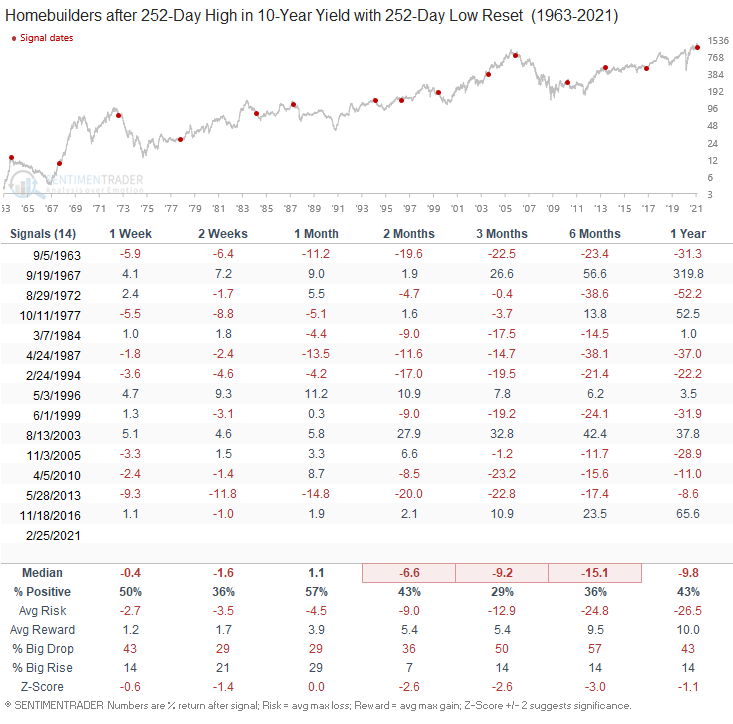
Homebuilders Performance
While there are other interest-rate-sensitive groups, the homebuilders provide a good example of how higher rates impact the business cycle.
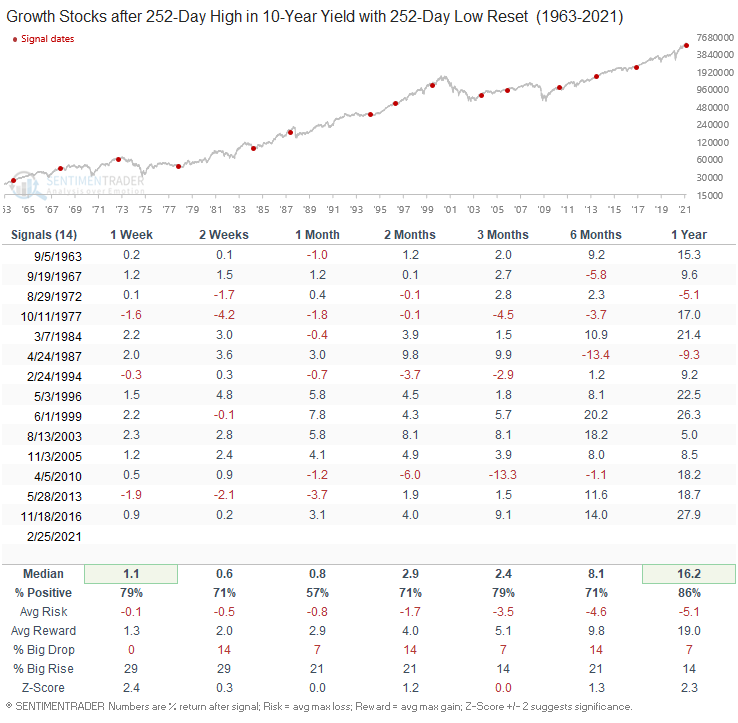
Growth Stock Performance
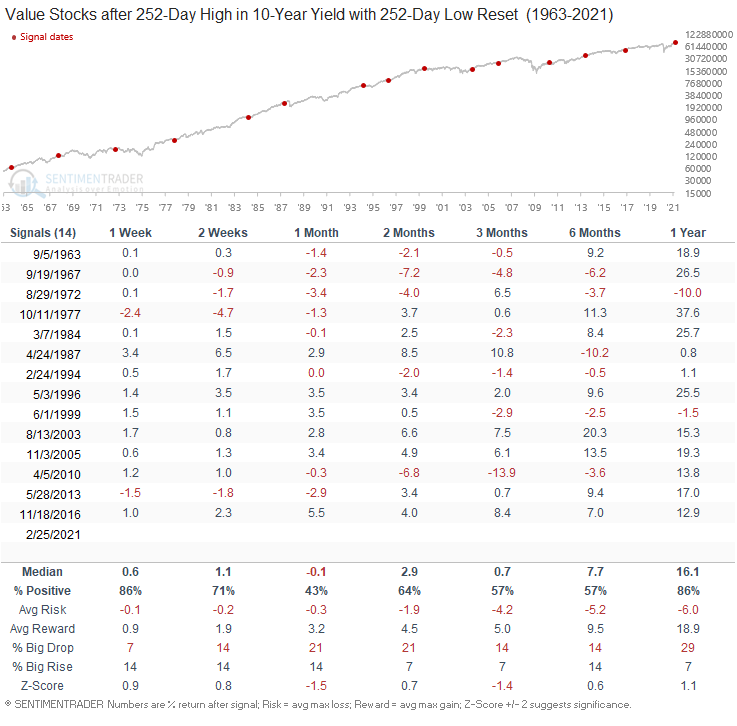
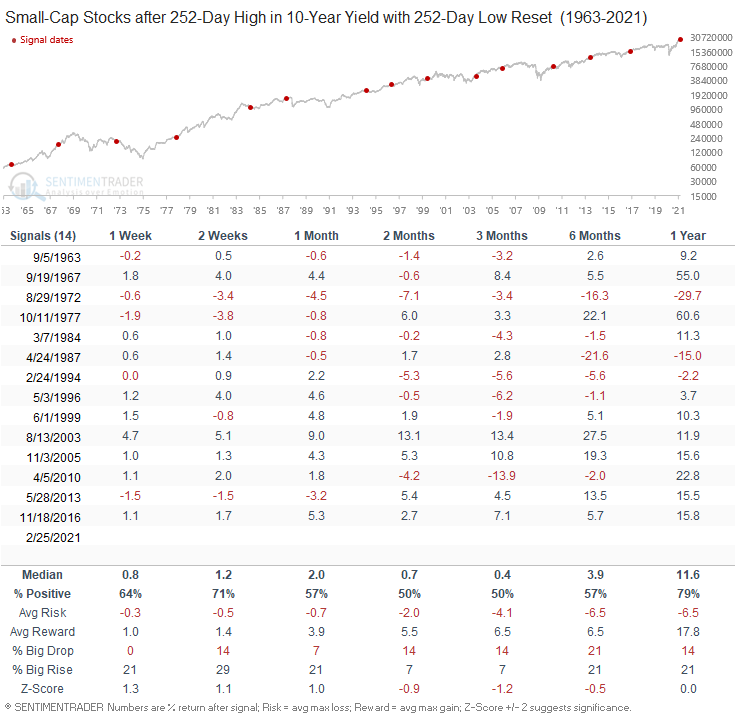
Please note, the growth, value, and small-cap performance numbers are derived from total return indices.
Value Stock Performance
Small-Cap Stock Performance
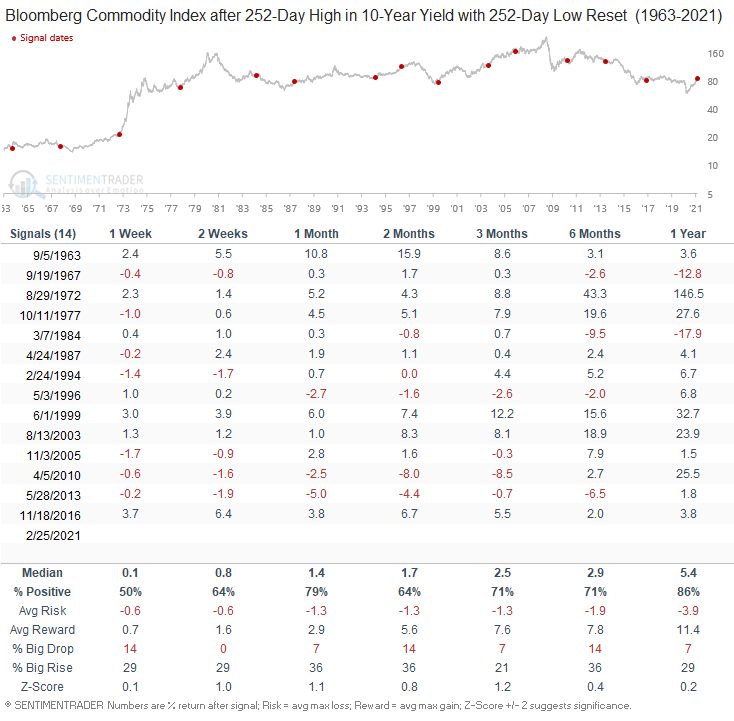
Commodity Performance
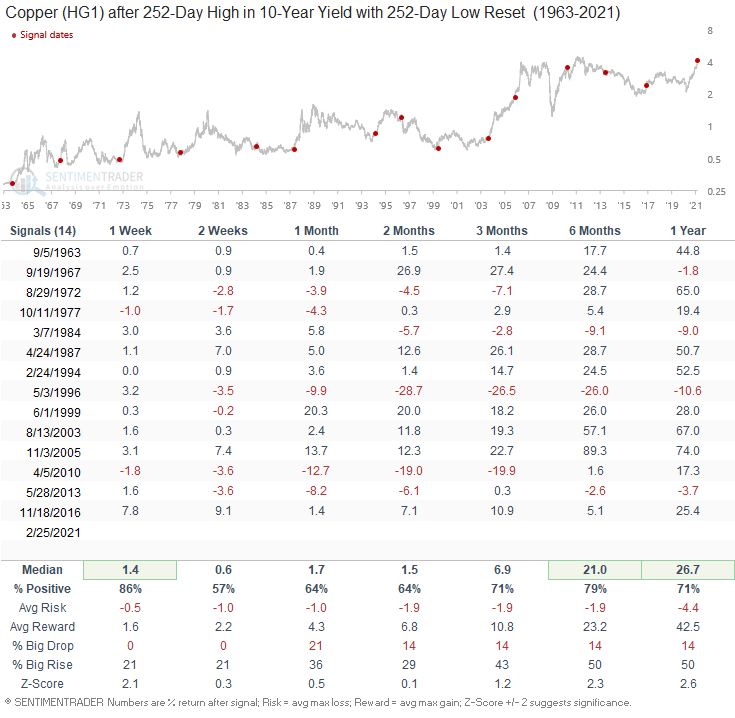
Copper Performance
I highlighted the strength in copper last week, and Jay had a note out this week. Performance looks solid.
Conclusion: With policy rates on hold and the Fed conducting QE, it will be fascinating to see what happens with rates and the yield curve over the next 6-12 months. The implications for asset allocation could be profound.