Data &
Technology
Research
Reports
Report Solutions
Reports Library
Actionable
Strategies
Free
Resources
Simple Backtest Calculator
Simple Seasonality Calculator
The Kelly Criterion Calculator
Sentiment Geo Map
Public Research Reports
Free Webinar
Pricing
Company
About
Meet Our Team
In the News
Testimonials
Client Success Stories
Contact
Log inLoginSign up
< BACK TO ALL REPORTS

2020 was just like...

Jason Goepfert
2021-01-05
The year 2020 was unlike any other in many respects, but in terms of the price path during the year, there were 20 years that had a high correlation.

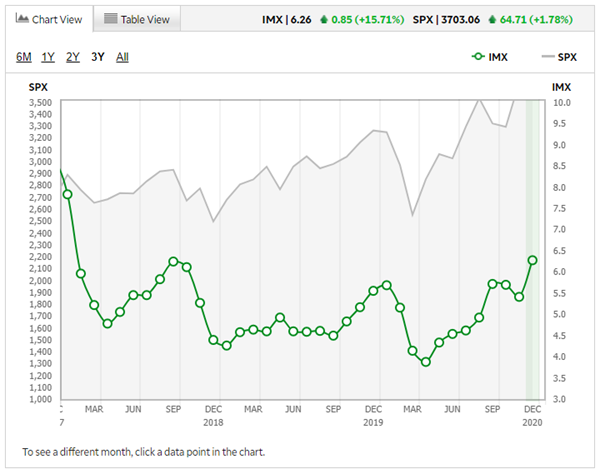
Even with a rally to close the year at new highs, and a consistently positive December, Dumb Money Confidence dipped from its record high, while Smart Money Confidence increased a bit. Though both measures eased from recent extremes, the protracted difference in sentiment means that we ended the year with one of the lowest spreads since we began calculating this 22 years ago.

It's hard to blame investors for having such high confidence. The most-benchmarked index in the world had quite a year, with no other quite like it. Still, since 1928 there were 20 other years that had a correlation of greater than +0.60 (on a scale from -1.0 to +1.0).

S&P 500 2020 analog correlation

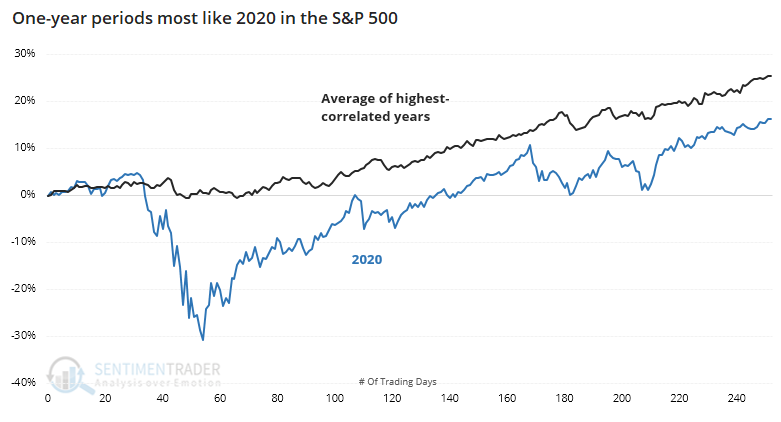
Going forward, those years showed modest positive returns, with a risk about equal to reward for the first two months. There was not a lot of consistency. 

Among sectors, we saw the most extreme behavior in tech stocks. There were 15 other years that had a relatively high correlation to 2020, at least in the general path, but not in magnitude. At the other end of the spectrum, energy stocks had the worst year of any sector. The worst stretch of any sector ever, really, so there were no years that had a high positive correlation to 2020. There were 15 of them that showed a correlation above +0.25, which is relatively weak.


What else is happening

These are topics we explored in our most recent research. For immediate access with no obligation, sign up for a 30-day free trial now.

  • Full details on forward returns following the closest analogs to 2020 in the S&P 500
  • What happened to tech stocks since 1928 after years that most closely matched 2020
  • Same for energy stocks
  • What happens when a year ends with extremely high Dumb Money and low Smart Money Confidence
  • The VIX jumped by a large amount but is still relatively low
  • A look at recent behavior among options traders
  • What happens when bitcoin suffers a negative reversal

Stat Box

While the concept of a "trading day" is sometimes hard to define for currencies, bitcoin had a nasty one on Monday. It had rallied more than 5% to a new high the day before, then gave all those gains back the next day. That's happened 5 other times in the past decade, leading to losses over the next month after 4 of them.

Sentiment from other perspectives

We don't necessarily agree with everything posted here - some of our work might directly contradict it - but it's often worth knowing what others are watching.

1. In December, traders at a major retail-focused brokerage were the most active in a couple of years. Activity tends to increase when stocks are doing well. [TD Ameritrade]

td ameritrade movement index

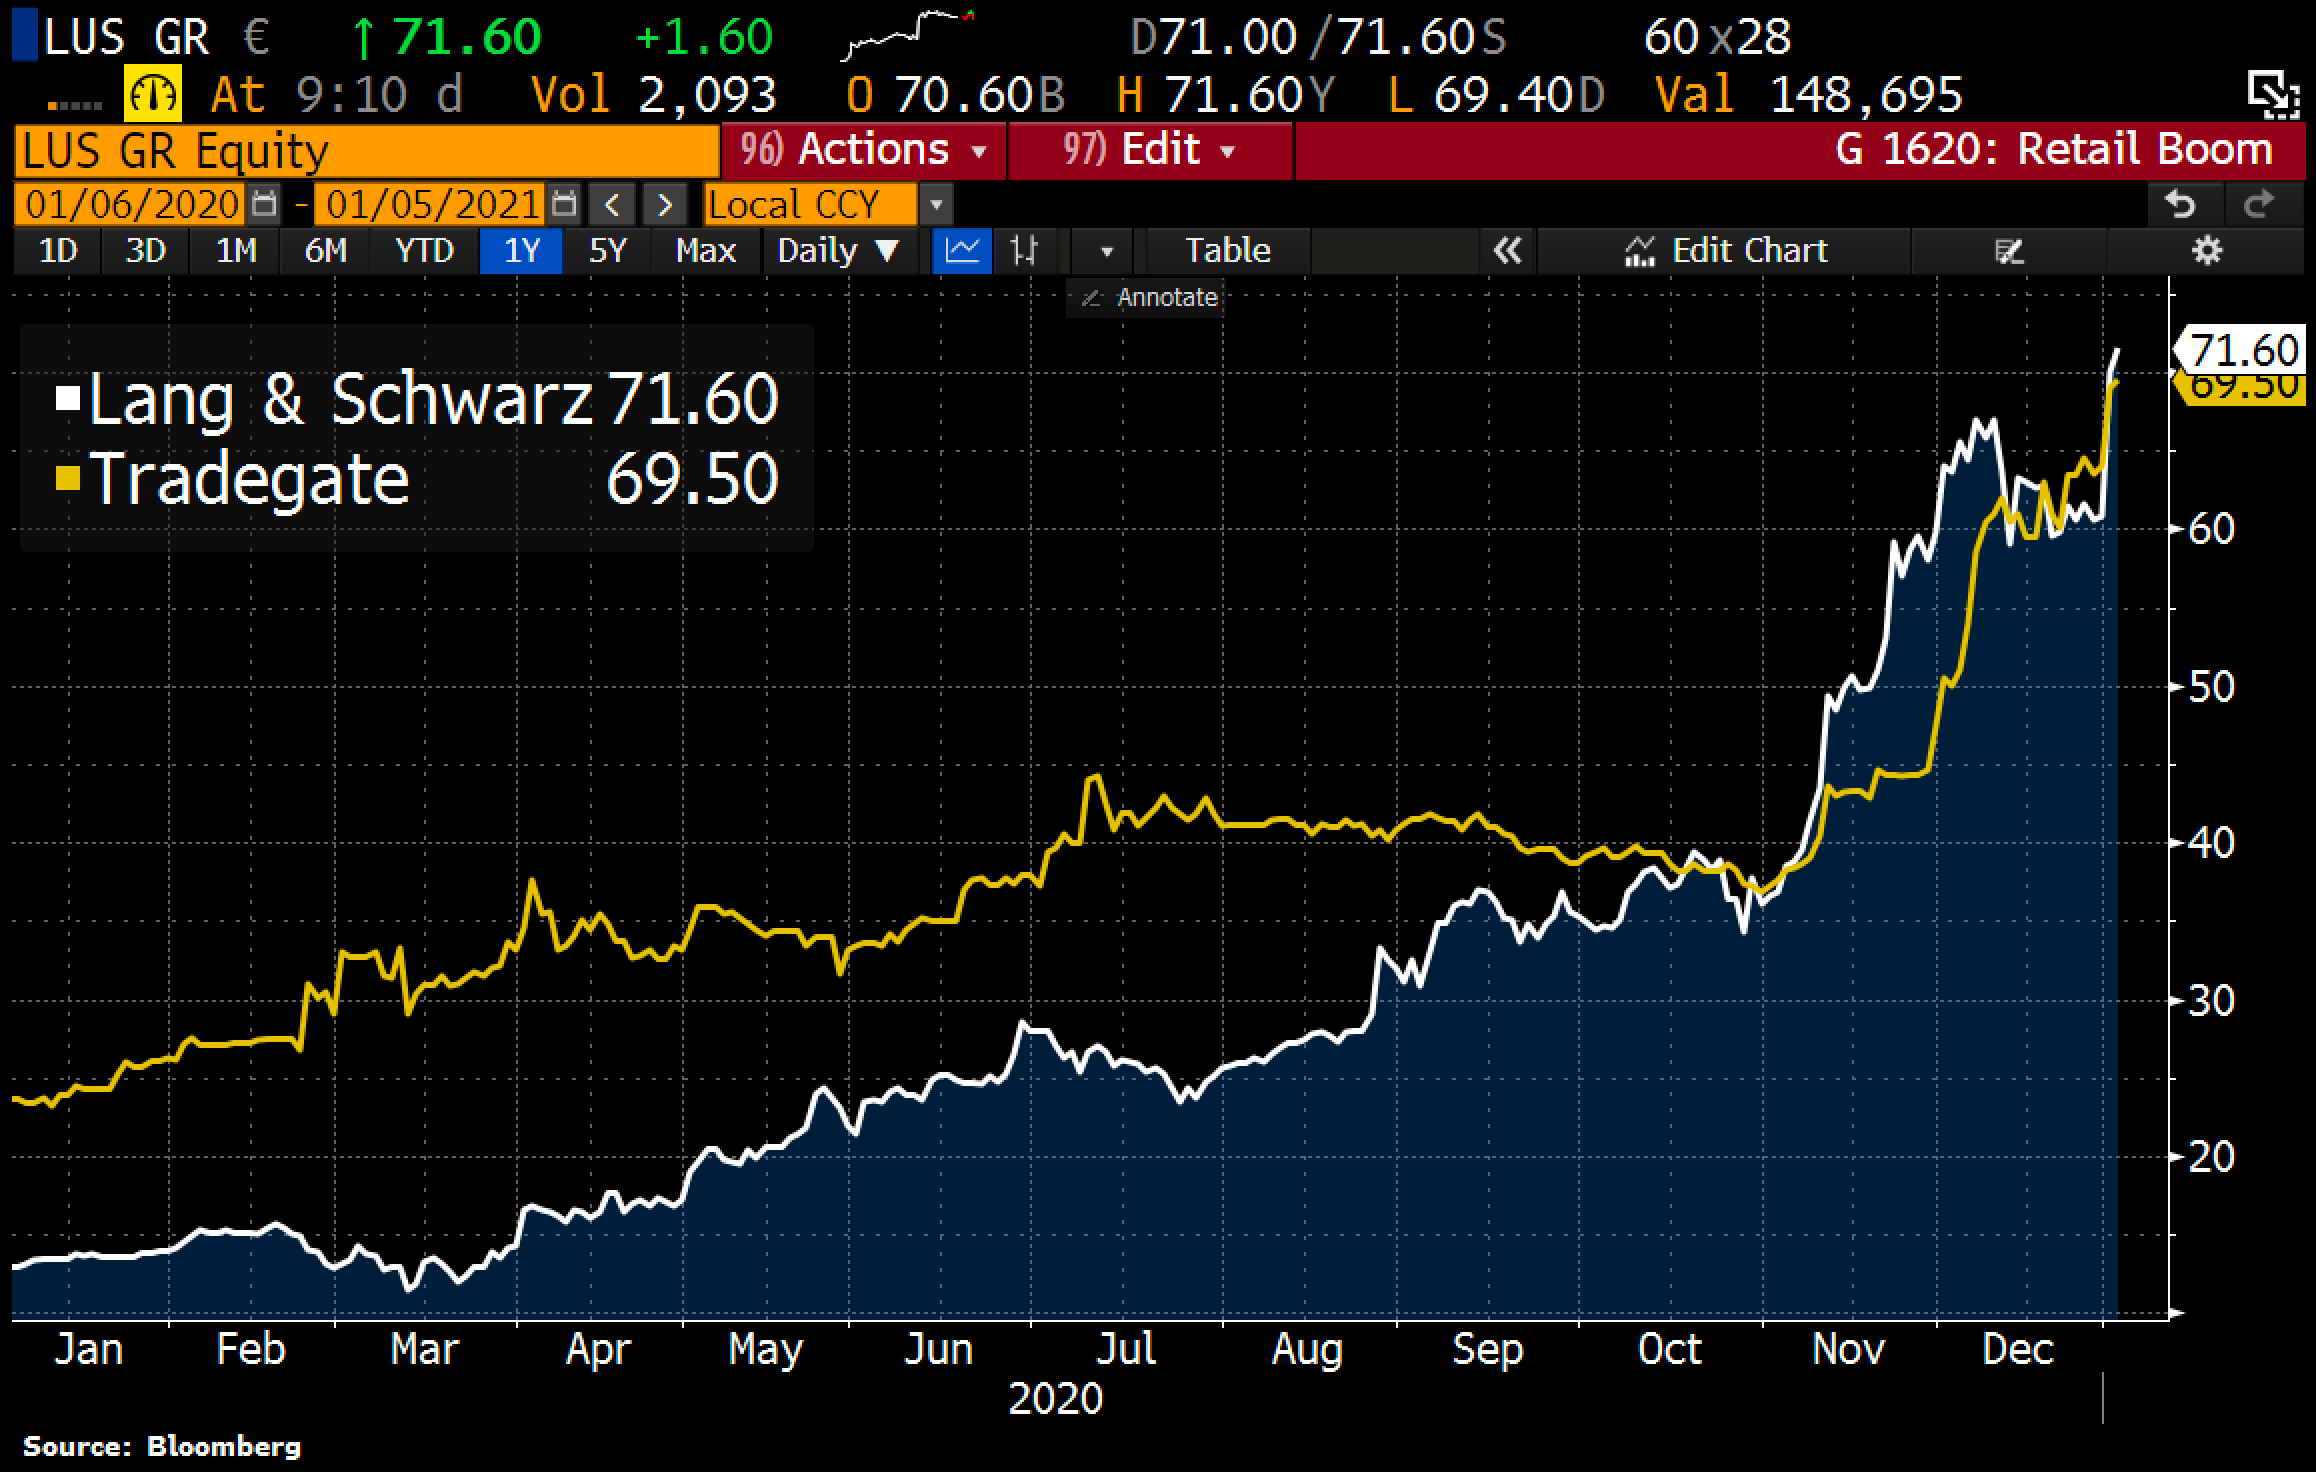
2. It's not just U.S. traders that have ignited a trading frenzy. In Germany, the stock prices of trading platforms have skyrocketed as trading volumes expand. [Holger Zschaepitz]

german stock broker stock prices

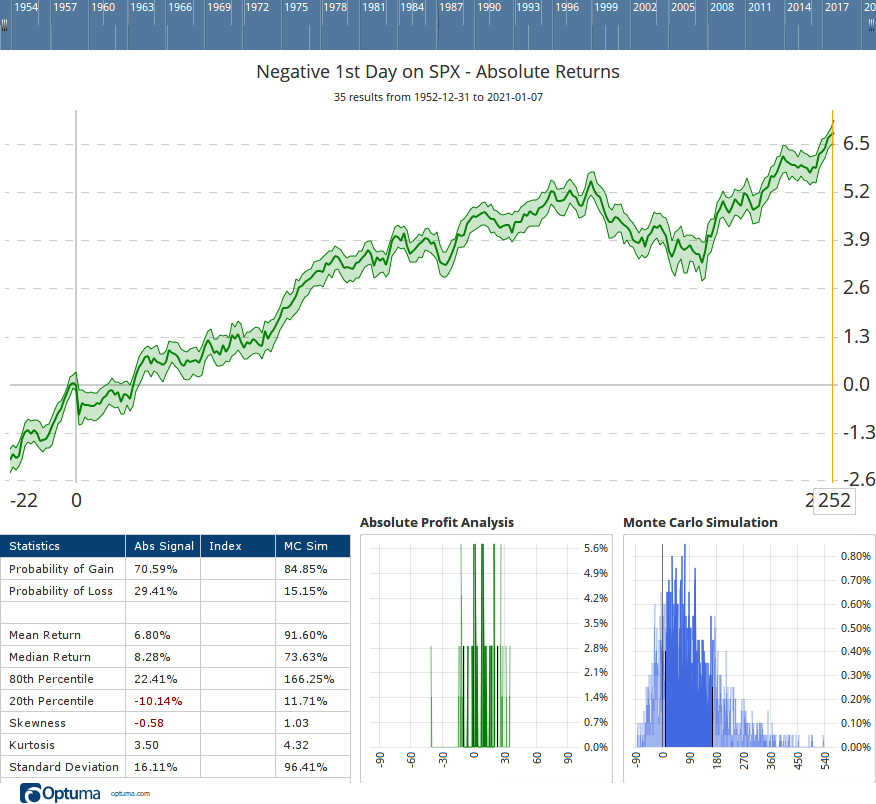
3. When the 1st trading day of the New Year sees selling pressure from investors, the full-year return has been about half that of years when investors were in a more ebullient mood. [Optuma]

first day of year negative

DATA &
TECHnologies
IndicatorEdge
‍
BackTestEdge
‍
Other Tools
‍
DataEdge API
RESEARCH
reports
Research Solution
‍
Reports Library
‍
actionable
Strategies
Trading Strategies
‍
Smart Stock Scanner
‍
FREE
RESOUrCES
Simple Backtest
Calculator
Simple Seasonality
Calculator
The Kelly Criterion
Calculator
Sentiment Geo Map
‍
Public Research Reports
‍
Free Webinar
COMPANY
‍
About
‍
Meet our Team
‍
In the News
‍
Testimonials
‍
Client Success Stories
Pricing
Bundle pricing
‍
Announcements
‍
FAQ
© 2024 Sundial Capital Research Inc. All rights reserved.
Setsail Marketing
TermsPrivacyAffiliate Program
Risk Disclosure: Futures and forex trading contains substantial risk and is not for every investor. An investor could potentially lose all or more than the initial investment. Risk capital is money that can be lost without jeopardizing ones’ financial security or life style. Only risk capital should be used for trading and only those with sufficient risk capital should consider trading. Past performance is not necessarily indicative of future results.

Hypothetical Performance Disclosure: Hypothetical performance results have many inherent limitations, some of which are described below. No representation is being made that any account will or is likely to achieve profits or losses similar to those shown; in fact, there are frequently sharp differences between hypothetical performance results and the actual results subsequently achieved by any particular trading program. One of the limitations of hypothetical performance results is that they are generally prepared with the benefit of hindsight. In addition, hypothetical trading does not involve financial risk, and no hypothetical trading record can completely account for the impact of financial risk of actual trading. for example, the ability to withstand losses or to adhere to a particular trading program in spite of trading losses are material points which can also adversely affect actual trading results. There are numerous other factors related to the markets in general or to the implementation of any specific trading program which cannot be fully accounted for in the preparation of hypothetical performance results and all which can adversely affect trading results.

Testimonial Disclosure: Testimonials appearing on this website may not be representative of other clients or customers and is not a guarantee of future performance or success.