1 Of The Whippiest, Most Uncertain Months In A Decade

This is an abridged version of our recent reports and notes. For immediate access with no obligation, sign up for a 30-day free trial now.
A whippy month
On an average day over the past month the S&P 500 has moved 1%, one of its widest ranges since the financial crisis.
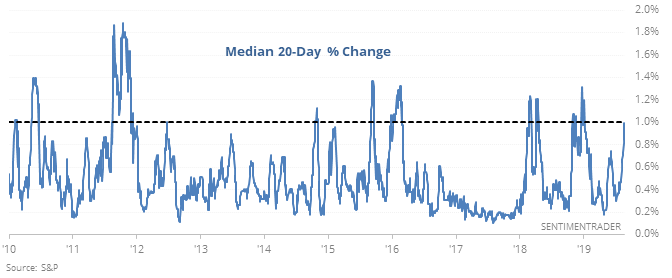
When coming soon after a new high in the index, there is a worry that this signals a long-term change in trend, but historically that has rarely proven to be the case.
It’s hard to find the negative spin here, especially since modern markets began in the 1950s.
This did happen a few months prior to the crash in ’87, and again before the bear markets began in 2000 and 2008, but there were long lead times. And there were even more false warning signs that led to little or no weakness versus large gains in the months ahead. Over the past 30 years, none of them led to a loss of more than 1% three months later.
Historic uncertainty
The wide swings in stocks are due in no small part to a historic level of uncertainty regarding the U.S. administration’s economic policies. An index of that uncertainty has spiked to a level that matches other major financial or geopolitical events.
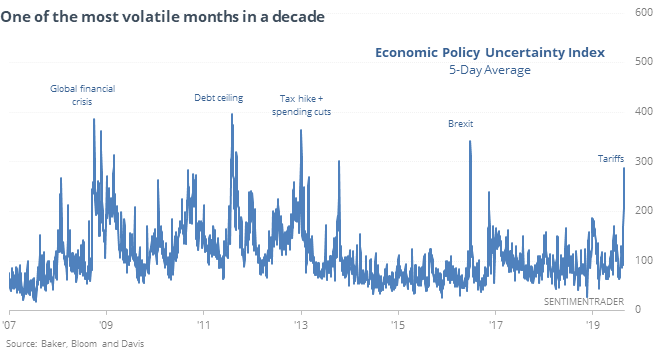
By the time it has gotten this high over the past 30 years, the uncertainty has almost without exception led to a positive return for stocks, with 1 loss out of 11 signals over the next 2-12 months. It wasn’t so good for the dollar, or gold, or Treasuries.
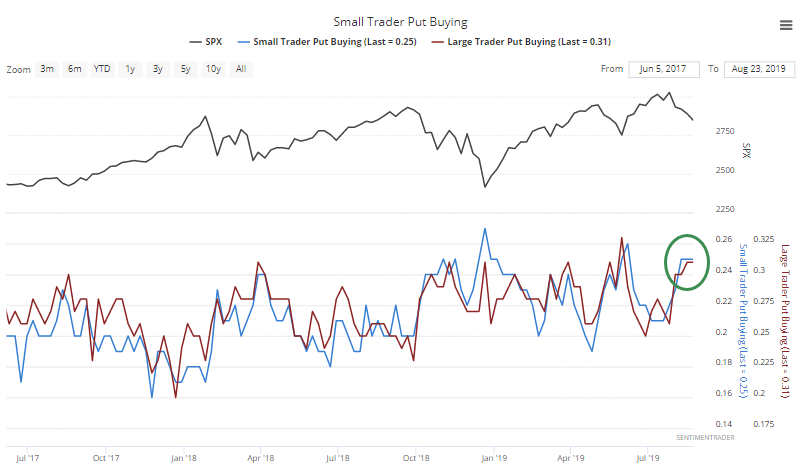
Lots of puts
For the past 3 weeks, the smallest of options traders have spent at least 25% of their volume buying to open put options. The largest of traders have spent at least 30% of their volume on puts. Since 2000, this has only happened once before, ending March 20, 2008. The S&P rallied more than 7% over the next couple of months before rolling over.
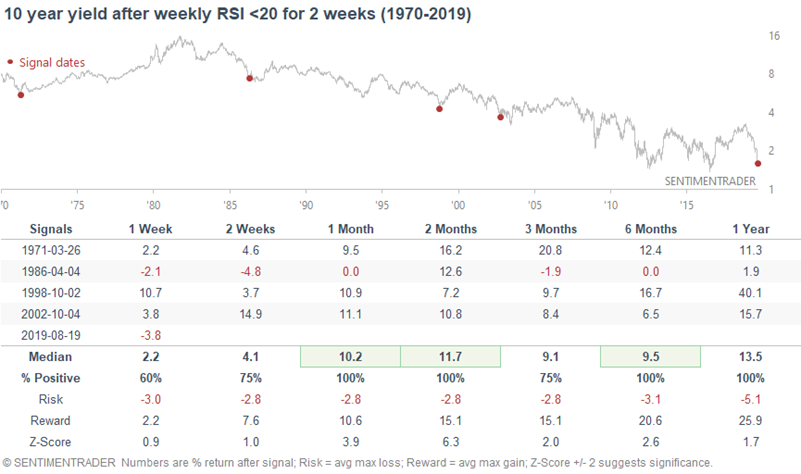
10 year Treasury yield
The 10 year Treasury yield continues to trend downwards, despite being oversold for weeks. But at this point, the rally in bonds seems to be overdone. The 10 year yield's 14 weekly RSI has been below 20 for 2 consecutive weeks.
In the past, this was about as extreme as it gets. The only 4 cases that were this extreme all saw the 10 year yield rally over the next 2 months.