Data &
Technology
Research
Reports
Report Solutions
Reports Library
Actionable
Strategies
Free
Resources
Simple Backtest Calculator
Simple Seasonality Calculator
The Kelly Criterion Calculator
Sentiment Geo Map
Public Research Reports
Free Webinar
Pricing
Company
About
Meet Our Team
In the News
Testimonials
Client Success Stories
Contact
Log inLoginSign up
< BACK TO ALL REPORTS

A New All-Time Closing High for The S&P 500 - How Does it Compare to History with Regards to Market Breadth?

Dean Christians
2021-01-08
A number of market breadth measures strengthened this week after some softening late last year. Let's take a look at how the most recent new all-time high in the S&P 500 compares to all other highs as it relates to market breadth.

The S&P 500 Index closed at a new all-time high on 8/18/2020 following the Pandemic crash. The Index has subsequently recorded 20 new all-time highs, with the most recent occurring on 1/7/21.  In today's note, I want to assess how current market breadth conditions compare to other historical readings since 1928 when the S&P 500 Index records a new all-time high.


Breadth Composite

Market breadth, otherwise known as internal participation, can be measured in several different ways across various time series and indicators. Participation-based indicators provide a look beneath the surface of an Index to quantify the underlying strength or weakness. For today's study, I plan to use a large-cap breadth composite that contains six measures with durations ranging anywhere from 10 to 252 days.

The composite includes the following:

  • Percentage of issues above the 10-day moving average
  • Percentage of issues above the 50-day moving average
  • Percentage of issues above the 200-day moving average
  • Percentage Spread Between 21-Day Highs and Lows
  • Percentage Spread Between 63-Day Highs and Lows
  • Percentage Spread Between 252-Day Highs and Lows

The individual component values are summed and divided by six to arrive at a single composite value. Please note, composite values can turn negative during corrections and bear markets as new lows overwhelm new highs in the spread calculation.


Breadth Composite Study

I first identified every single all-time closing high in the S&P 500 Index since 1928. According to my calculation, there are 1,276 instances. I then ranked each breadth composite value on the day of the all-time closing high. Rankings range from 100 (strongest) to 0 (weakest). By ranking each all-time high, I can now make an apples-to-apple comparison throughout history.


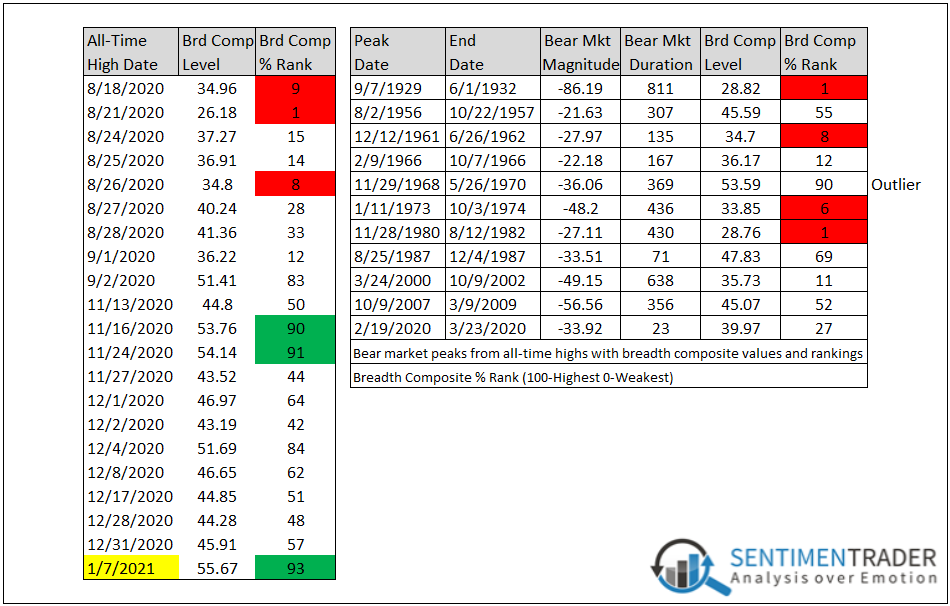
Composite Breadth Comparison

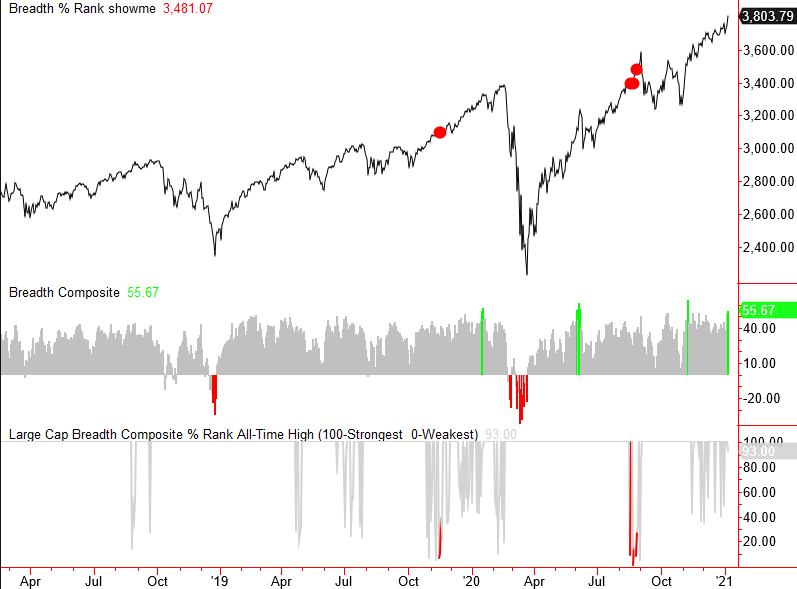
The first table below shows the initial all-time highs starting in August exhibited weak breadth rankings compared to other instances since 1928. After a multi-month consolidation in the market, the S&P 500 surged in early November, and the rankings spiked into the 90th percentile. Following some softening in December, breadth strengthened again with a level back in the 90th percentile on the 1/7/21 close. 

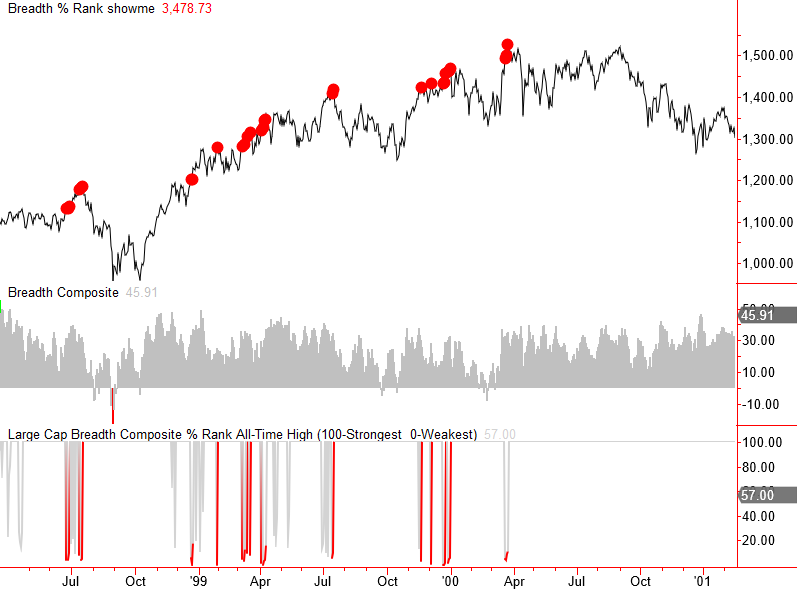
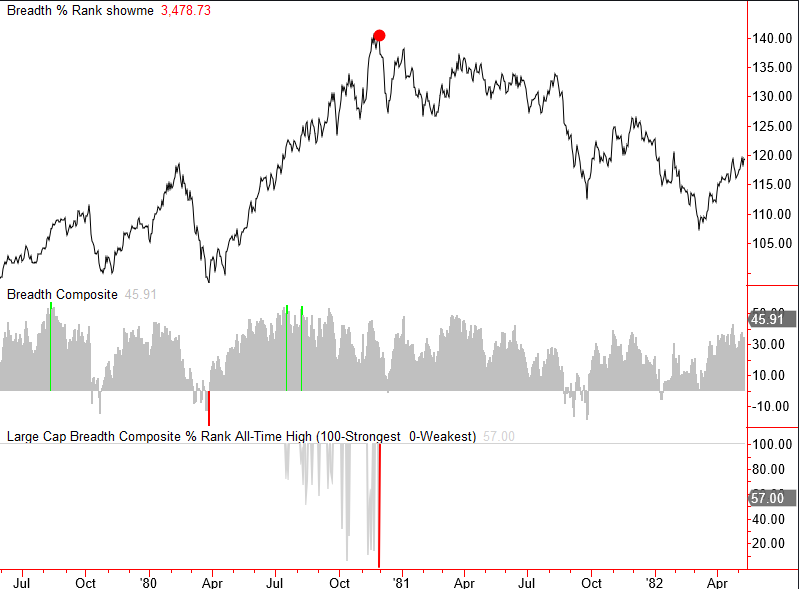
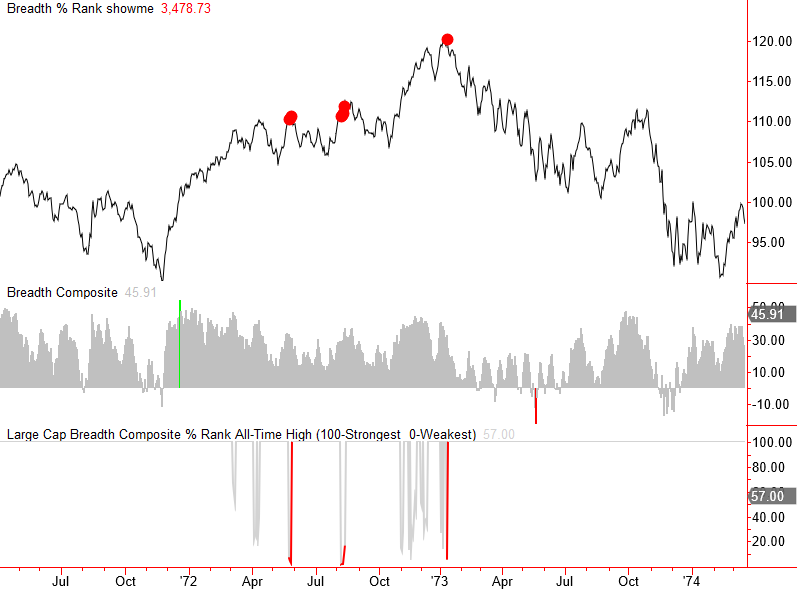
Conclusion: Breadth remains firm and nowhere near the levels associated with bear market peaks, as exhibited in the second table.
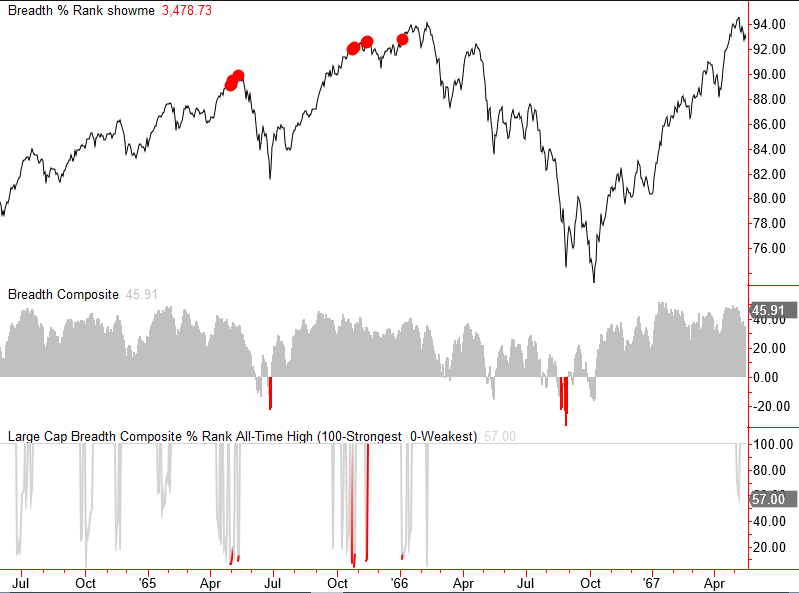
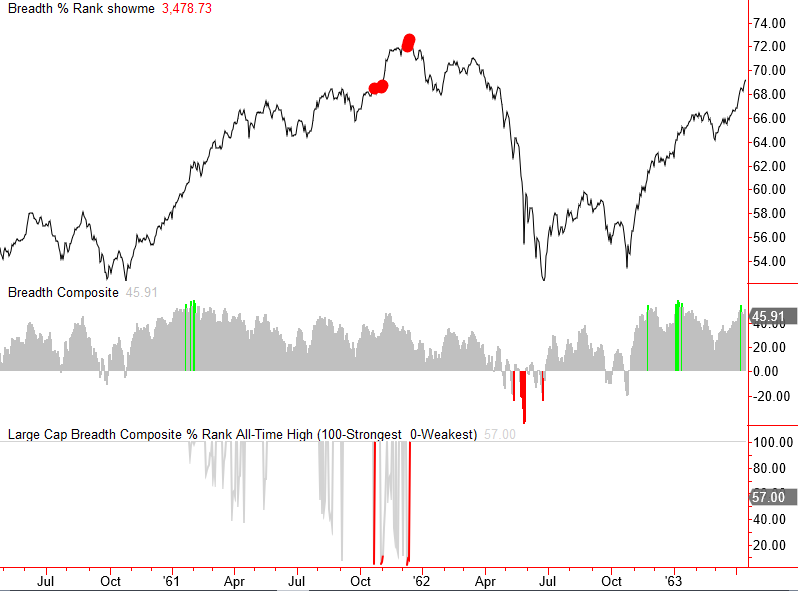
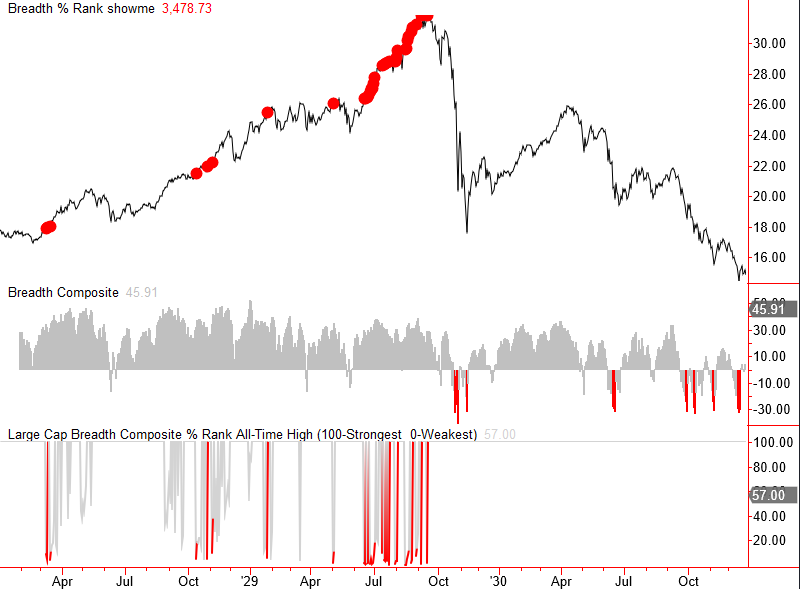


Sample Charts

The charts in the study contain the following three indicators:

  1. The breadth composite value
  2. The relative % rank for breadth composite values at all-time highs
  3. A red dot to indicate a rank of 10% or less (weak breadth at a high)


Sorry, you don't have access to this report

Upgrade your subscription plan to get access
Go to Dasboard
DATA &
TECHnologies
IndicatorEdge
‍
BackTestEdge
‍
Other Tools
‍
DataEdge API
RESEARCH
reports
Research Solution
‍
Reports Library
‍
actionable
Strategies
Trading Strategies
‍
Smart Stock Scanner
‍
FREE
RESOUrCES
Simple Backtest
Calculator
Simple Seasonality
Calculator
The Kelly Criterion
Calculator
Sentiment Geo Map
‍
Public Research Reports
‍
Free Webinar
COMPANY
‍
About
‍
Meet our Team
‍
In the News
‍
Testimonials
‍
Client Success Stories
Pricing
Bundle pricing
‍
Announcements
‍
FAQ
© 2024 Sundial Capital Research Inc. All rights reserved.
Setsail Marketing
TermsPrivacyAffiliate Program
Risk Disclosure: Futures and forex trading contains substantial risk and is not for every investor. An investor could potentially lose all or more than the initial investment. Risk capital is money that can be lost without jeopardizing ones’ financial security or life style. Only risk capital should be used for trading and only those with sufficient risk capital should consider trading. Past performance is not necessarily indicative of future results.

Hypothetical Performance Disclosure: Hypothetical performance results have many inherent limitations, some of which are described below. No representation is being made that any account will or is likely to achieve profits or losses similar to those shown; in fact, there are frequently sharp differences between hypothetical performance results and the actual results subsequently achieved by any particular trading program. One of the limitations of hypothetical performance results is that they are generally prepared with the benefit of hindsight. In addition, hypothetical trading does not involve financial risk, and no hypothetical trading record can completely account for the impact of financial risk of actual trading. for example, the ability to withstand losses or to adhere to a particular trading program in spite of trading losses are material points which can also adversely affect actual trading results. There are numerous other factors related to the markets in general or to the implementation of any specific trading program which cannot be fully accounted for in the preparation of hypothetical performance results and all which can adversely affect trading results.

Testimonial Disclosure: Testimonials appearing on this website may not be representative of other clients or customers and is not a guarantee of future performance or success.