A Buy Signal That Has Never Failed
Some selling pressure to start the week made sense. There were ample and increasing signs of deterioration under the surface of the indexes, and it finally caught up to them.
In yet another concerted effort to buy every dip, though, that weakness lasted all of about one day. The buying stampede on Tuesday was remarkable, and it more than reversed the selling pressure from the day before.
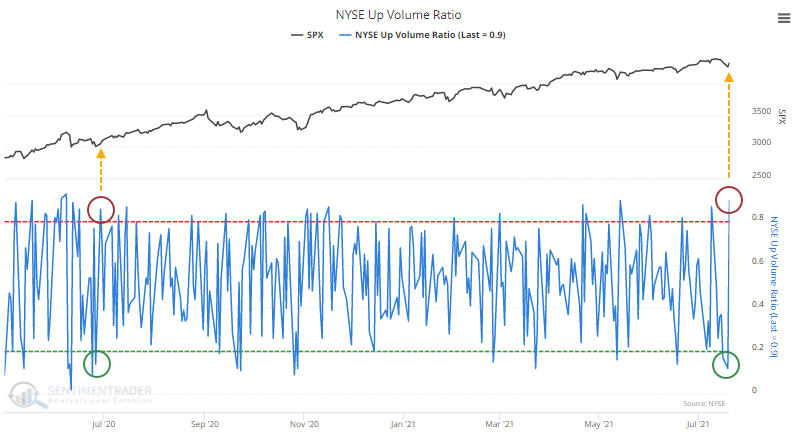
The Up Volume Ratio cycled from below 15% to above 85% in back-to-back sessions on the NYSE.

This triggered last June, and it marked the end of that little pullback, kicking off an impressive run over the next few months. That was much more the rule than the exception after a back-to-back reversal in Up Volume while the S&P 500 was within 10% of a 52-week high.
Since 1962, the S&P 500 never showed a loss in the month following similar signals. These mostly occurred during momentum markets, and buyers followed through to avoid missing out on the next bull run. A few of them did end up leading to blow-off peaks, but not until month(s) later.
What else we're looking at
- Full returns in the S&P 500 after back-to-back Up Volume reversals
- What happens after reversals in bear markets
- Sector and factor returns after Up Volume Reversals
- An options trade idea on the Nasdaq 100 Trust, QQQ
- A reversal concept with the McClellan Oscillator for the Energy sector
| Stat box On Wednesday, more than 80% of volume on the NYSE flowed into advancing securities, the 2nd day in a row. These are the first back-to-back sessions with more than 80% up volume in 8 months. |
Etcetera
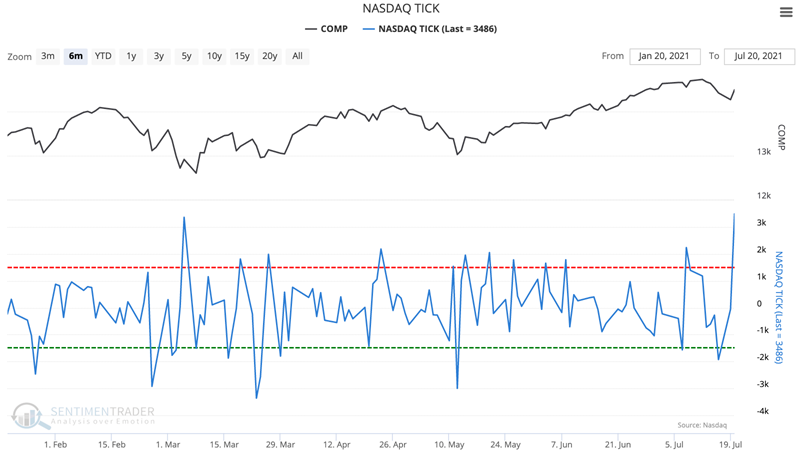
Reversal. NASDAQ Tick went from a two-month low to an eight-month high, showing concentrated selling pressure, then the exact opposite.

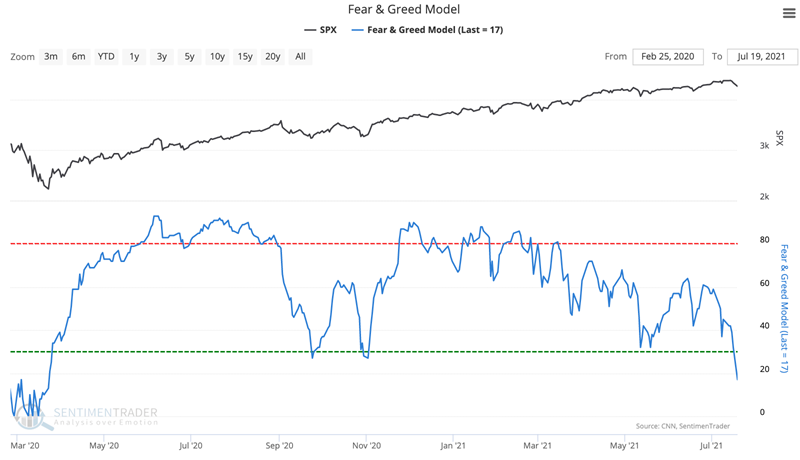
Despondency. The Fear & Greed Model has dipped to its lowest point since March 2020, showing Fear in the market.

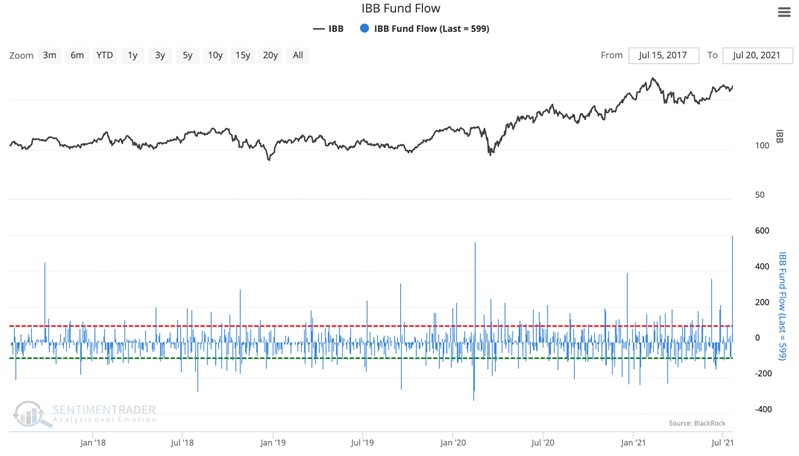
Cash flow. The IBB Biotech Fund saw a single day inflow of almost $600 million, its largest intake of cash in 5 years.


