
Zweig Breadth Thrust Recovery

Key Points:
- The Zweig Breadth Thrust has completed a recovery from below 0.4 to above 0.59.
- The McClellan Oscillator (McC), while not reaching oversold levels, has shown a similar recovery.
- The closing price of the SPX has formed a V-like pattern.
Recovery of the Zweig Indicator
The Zweig Breadth Thrust indicator, named after the late money manager Marty Zweig, has long been regarded as the "holy grail" for the start of a bull market.
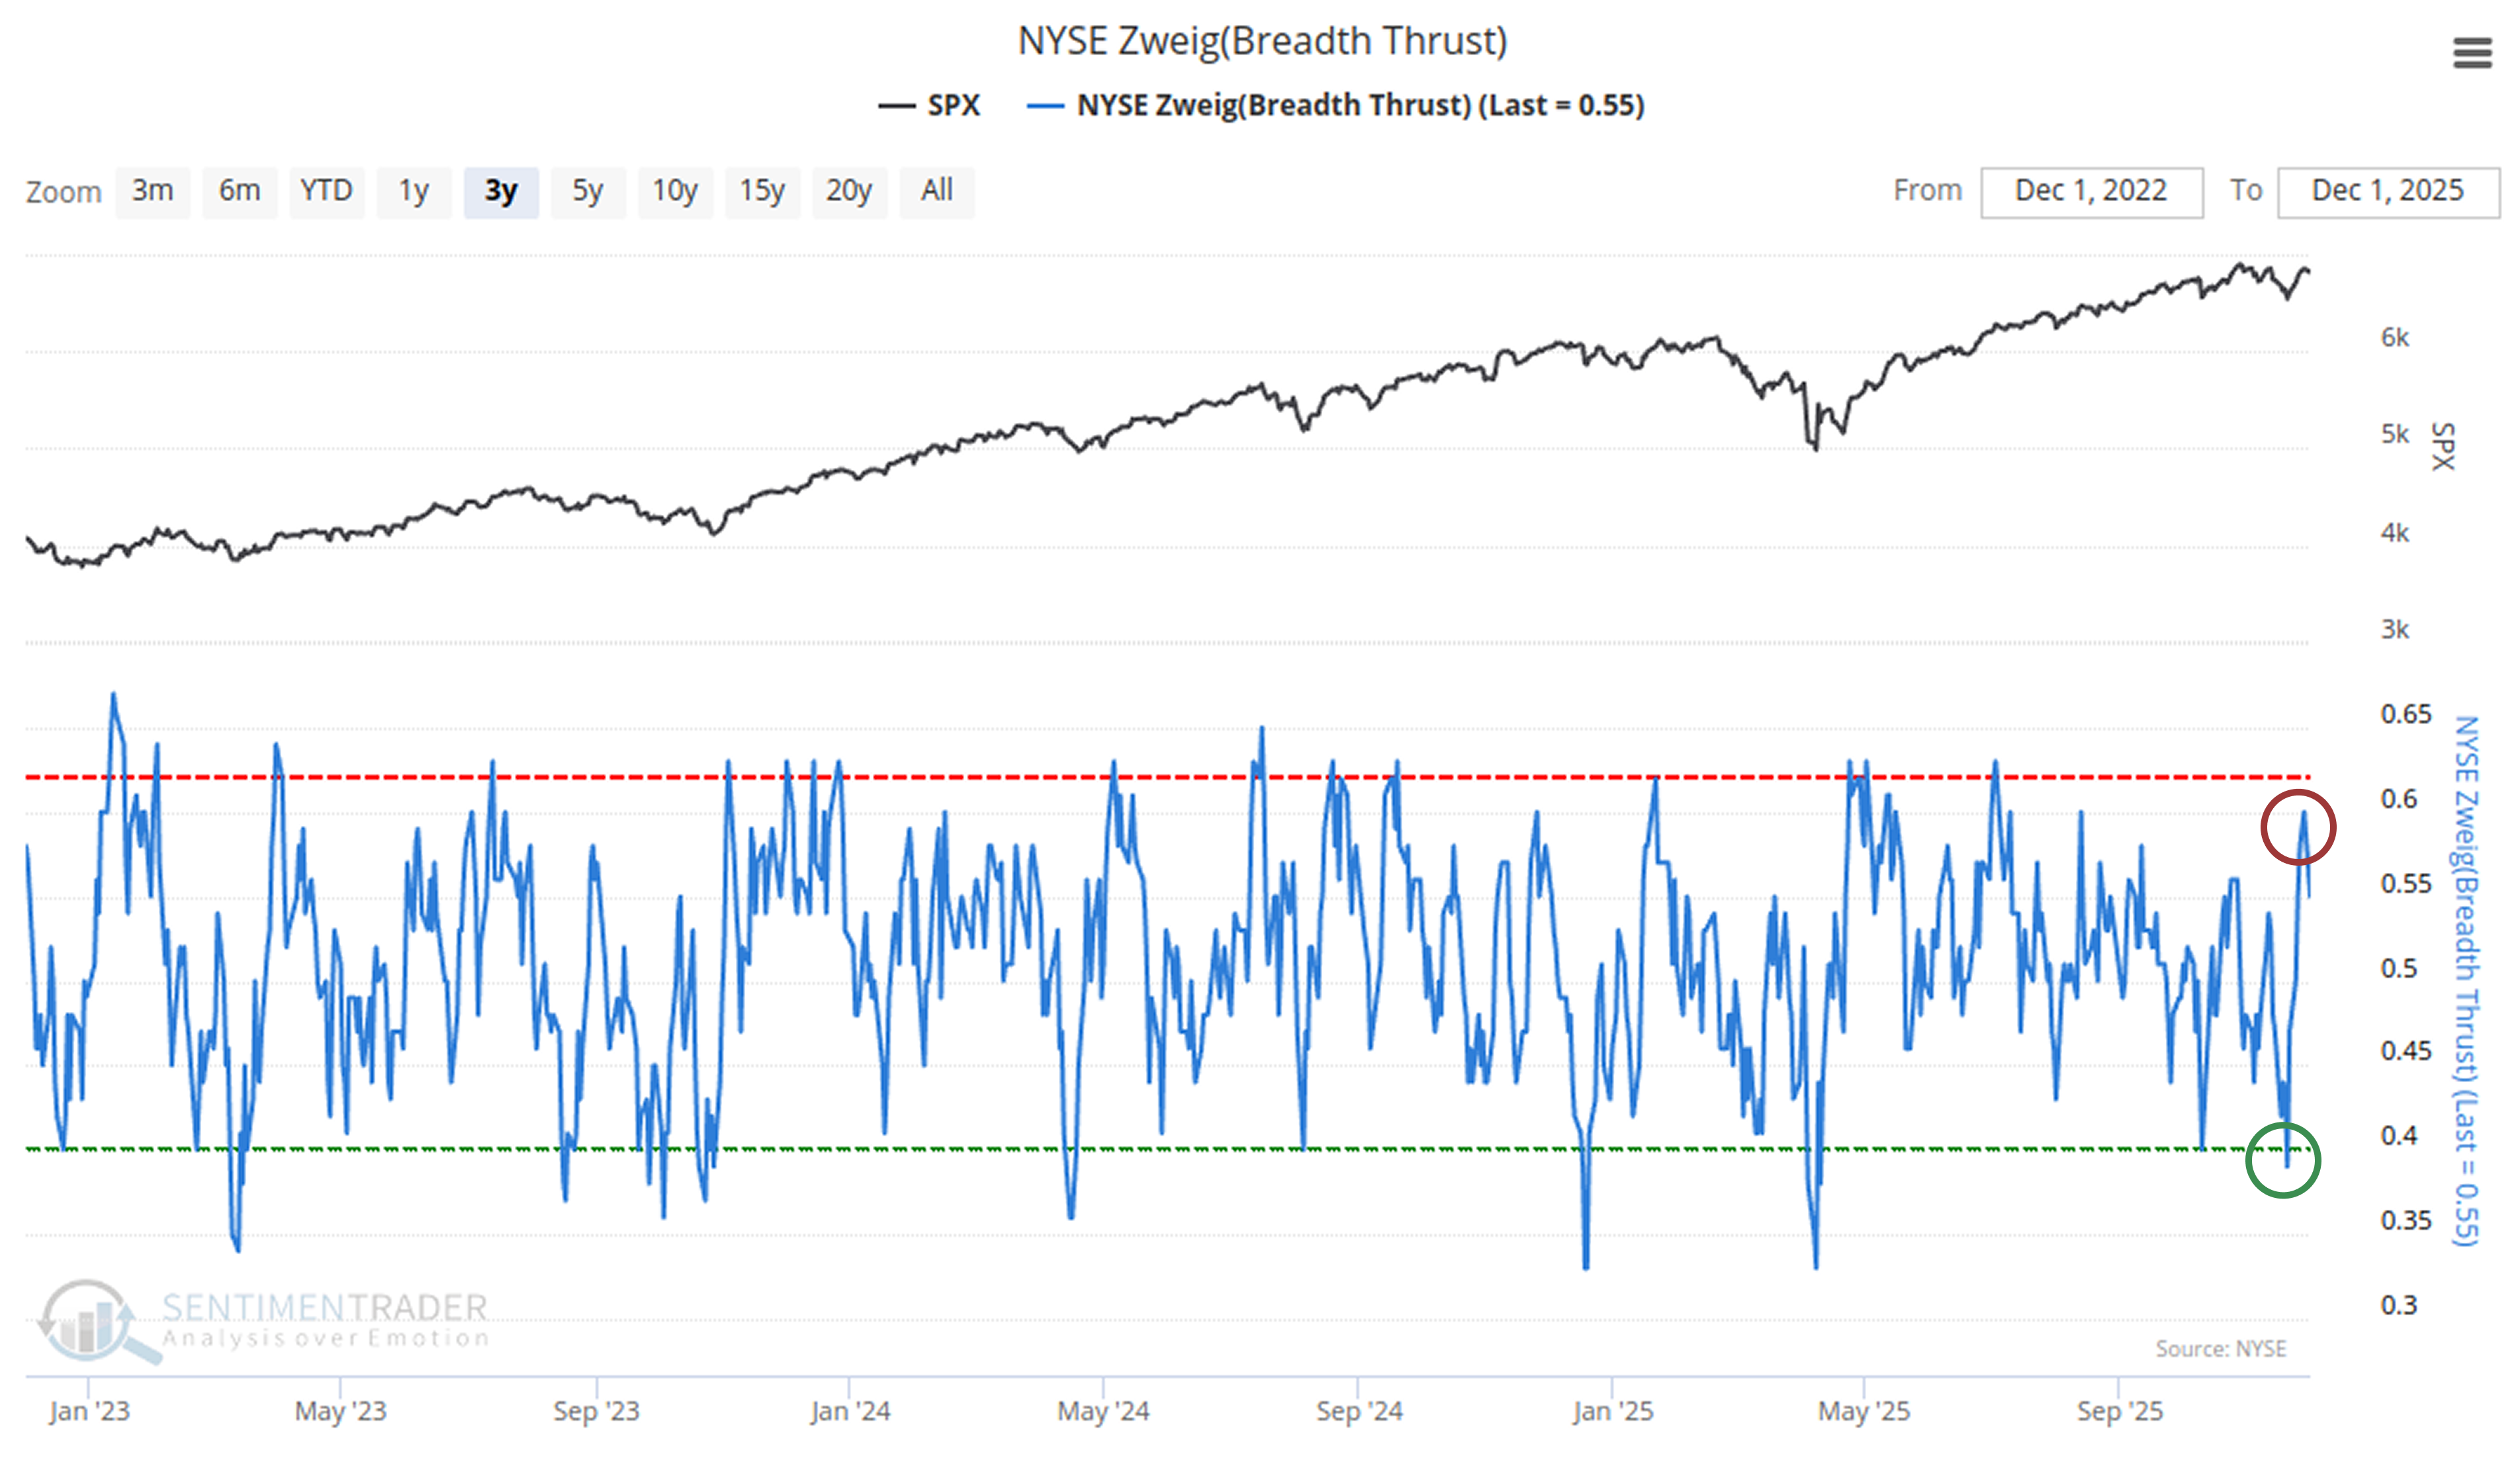
Recently, as can be seen from the chart, the indicator has quickly recovered from below 0.4 to above 0.59 within 10 trading days. Although it has not reached the ZBT signal (i.e., recovery to 0.62 or above), as a slightly weakened signal, we can still observe how the market performs amid such a rapid recovery. The chart below shows the Zweig indicator quickly recovering from below 0.4 to above 0.59 within 10 trading days:Related Backtest Click Here.
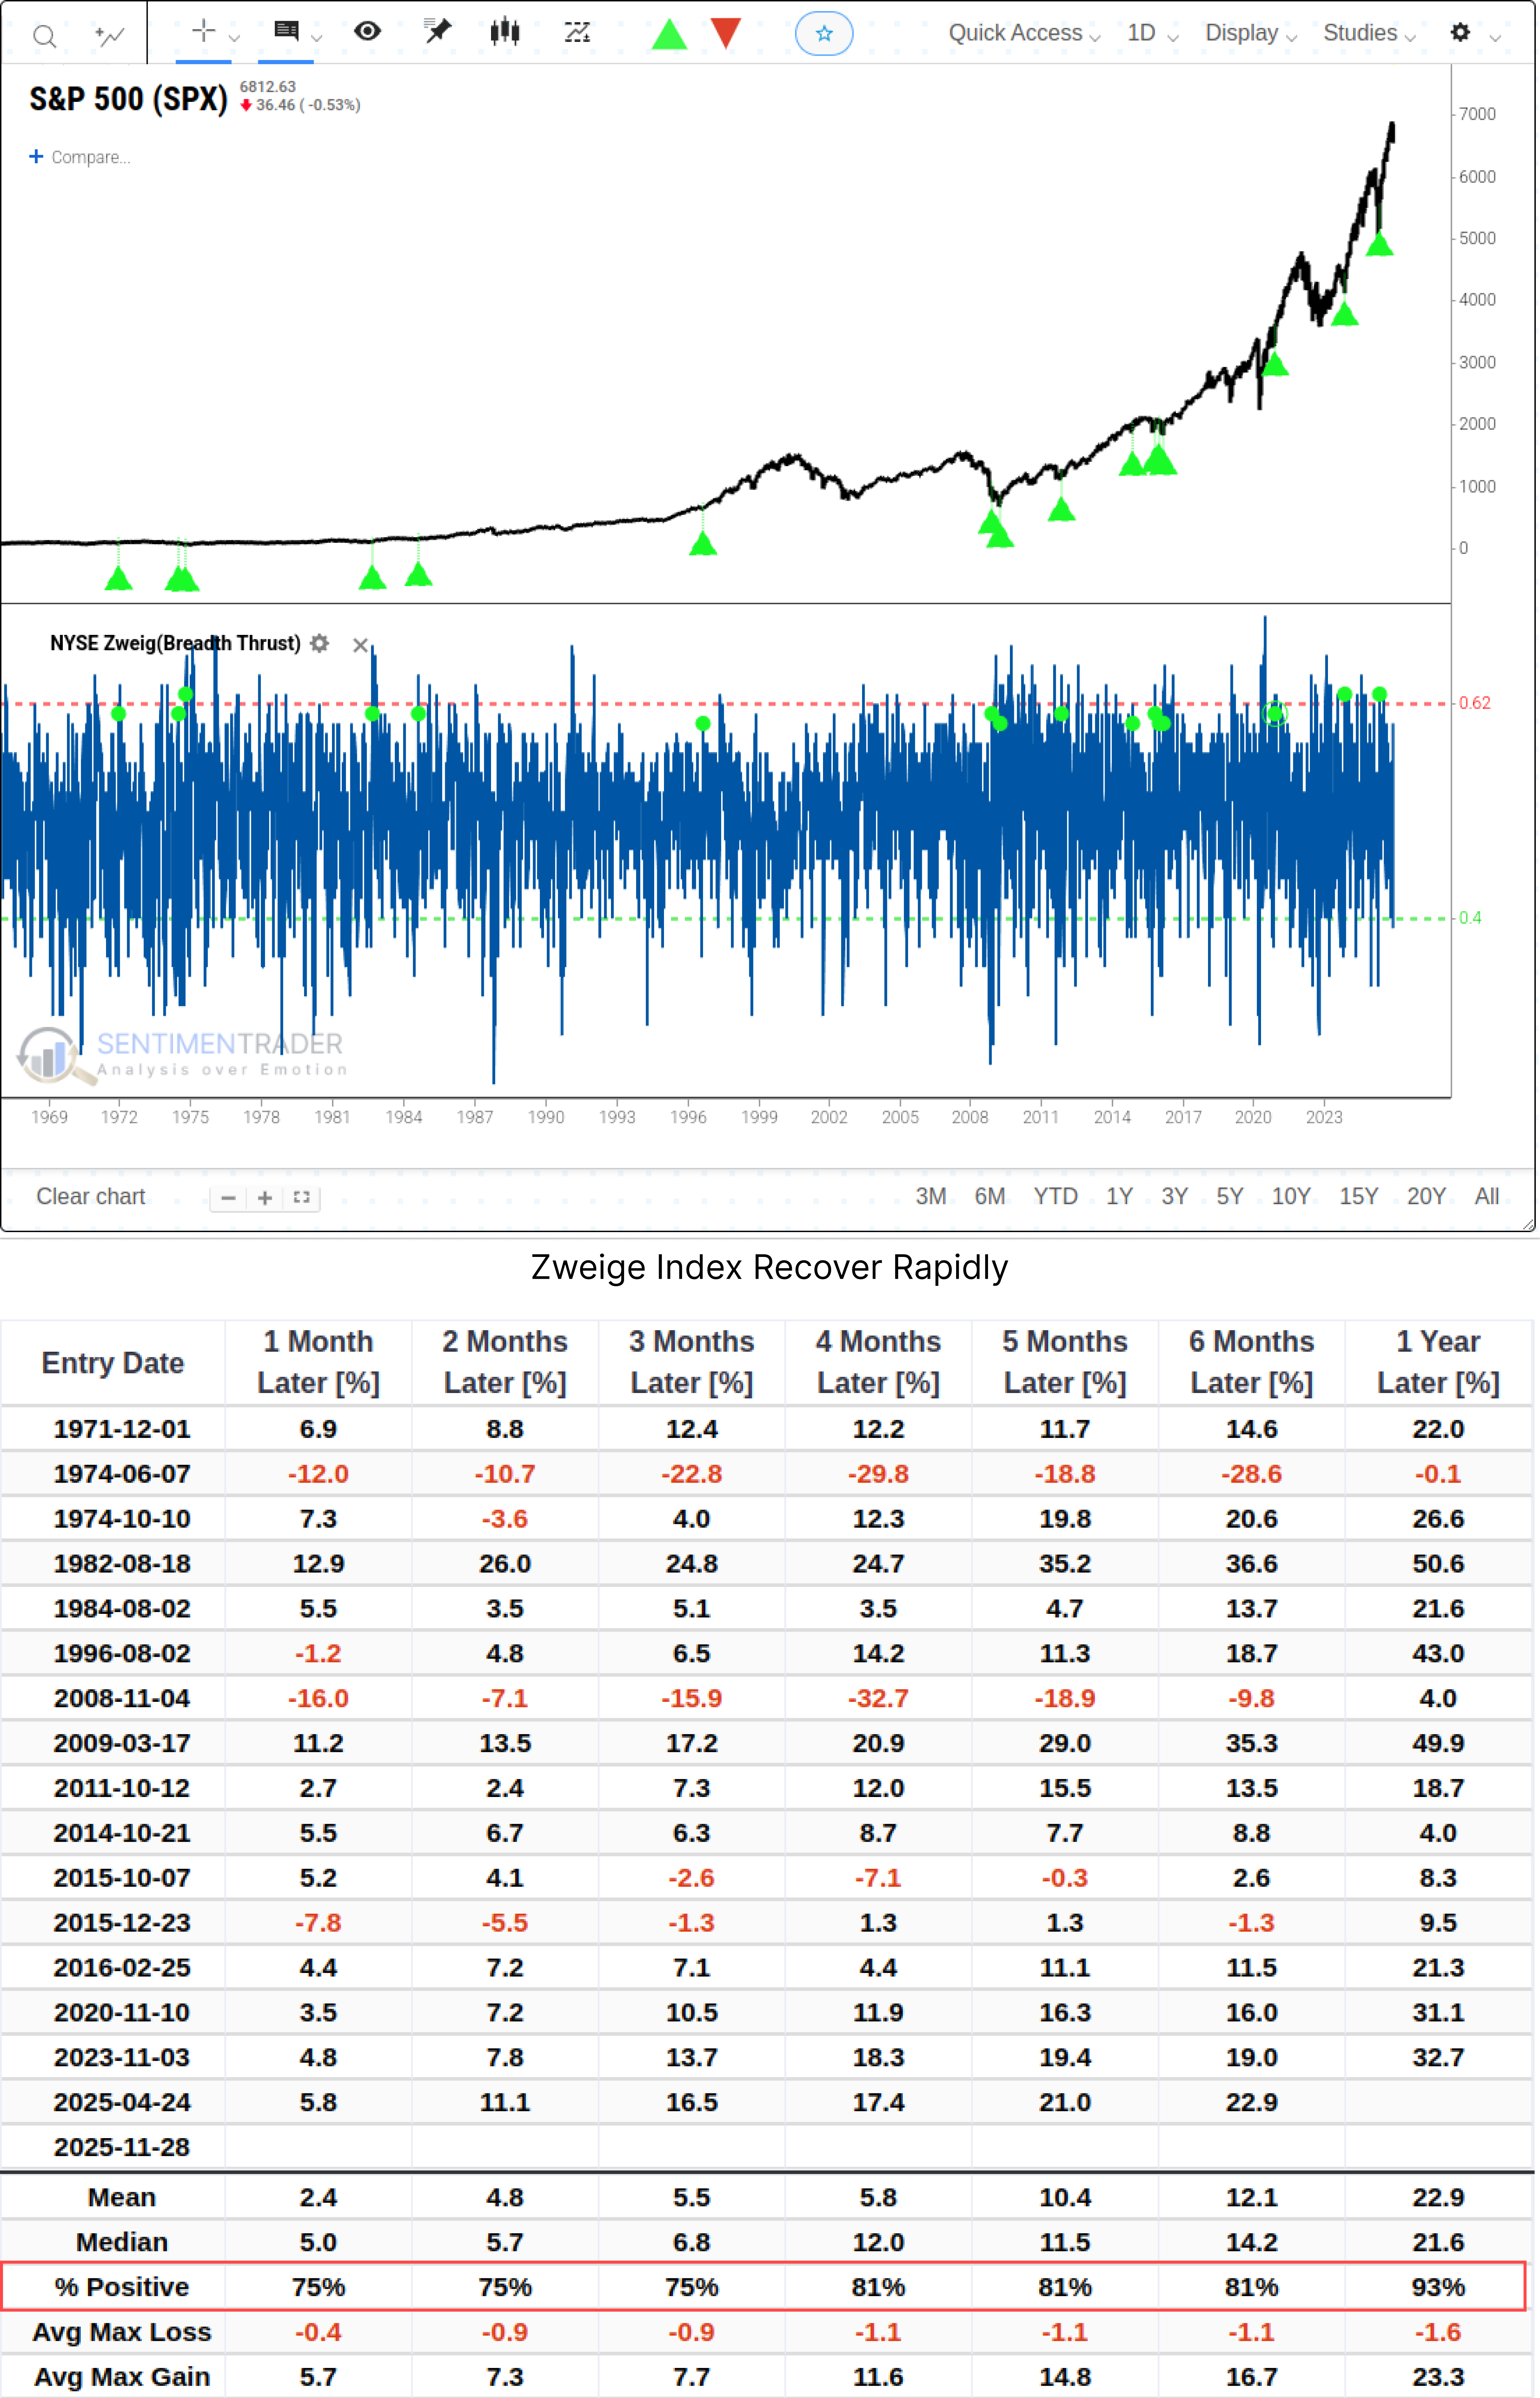
The table of maximum profits and losses over various time periods for the 16 signals in the chart demonstrates the bullish impact of these signals on the S&P 500 Index. Even after one year, the average maximum drawdown is only -1.6%, with a win rate as high as 93%. However, cases from 1974 and 2008 in historical data remind us that such recoveries can sometimes evolve into cruel "bull traps".
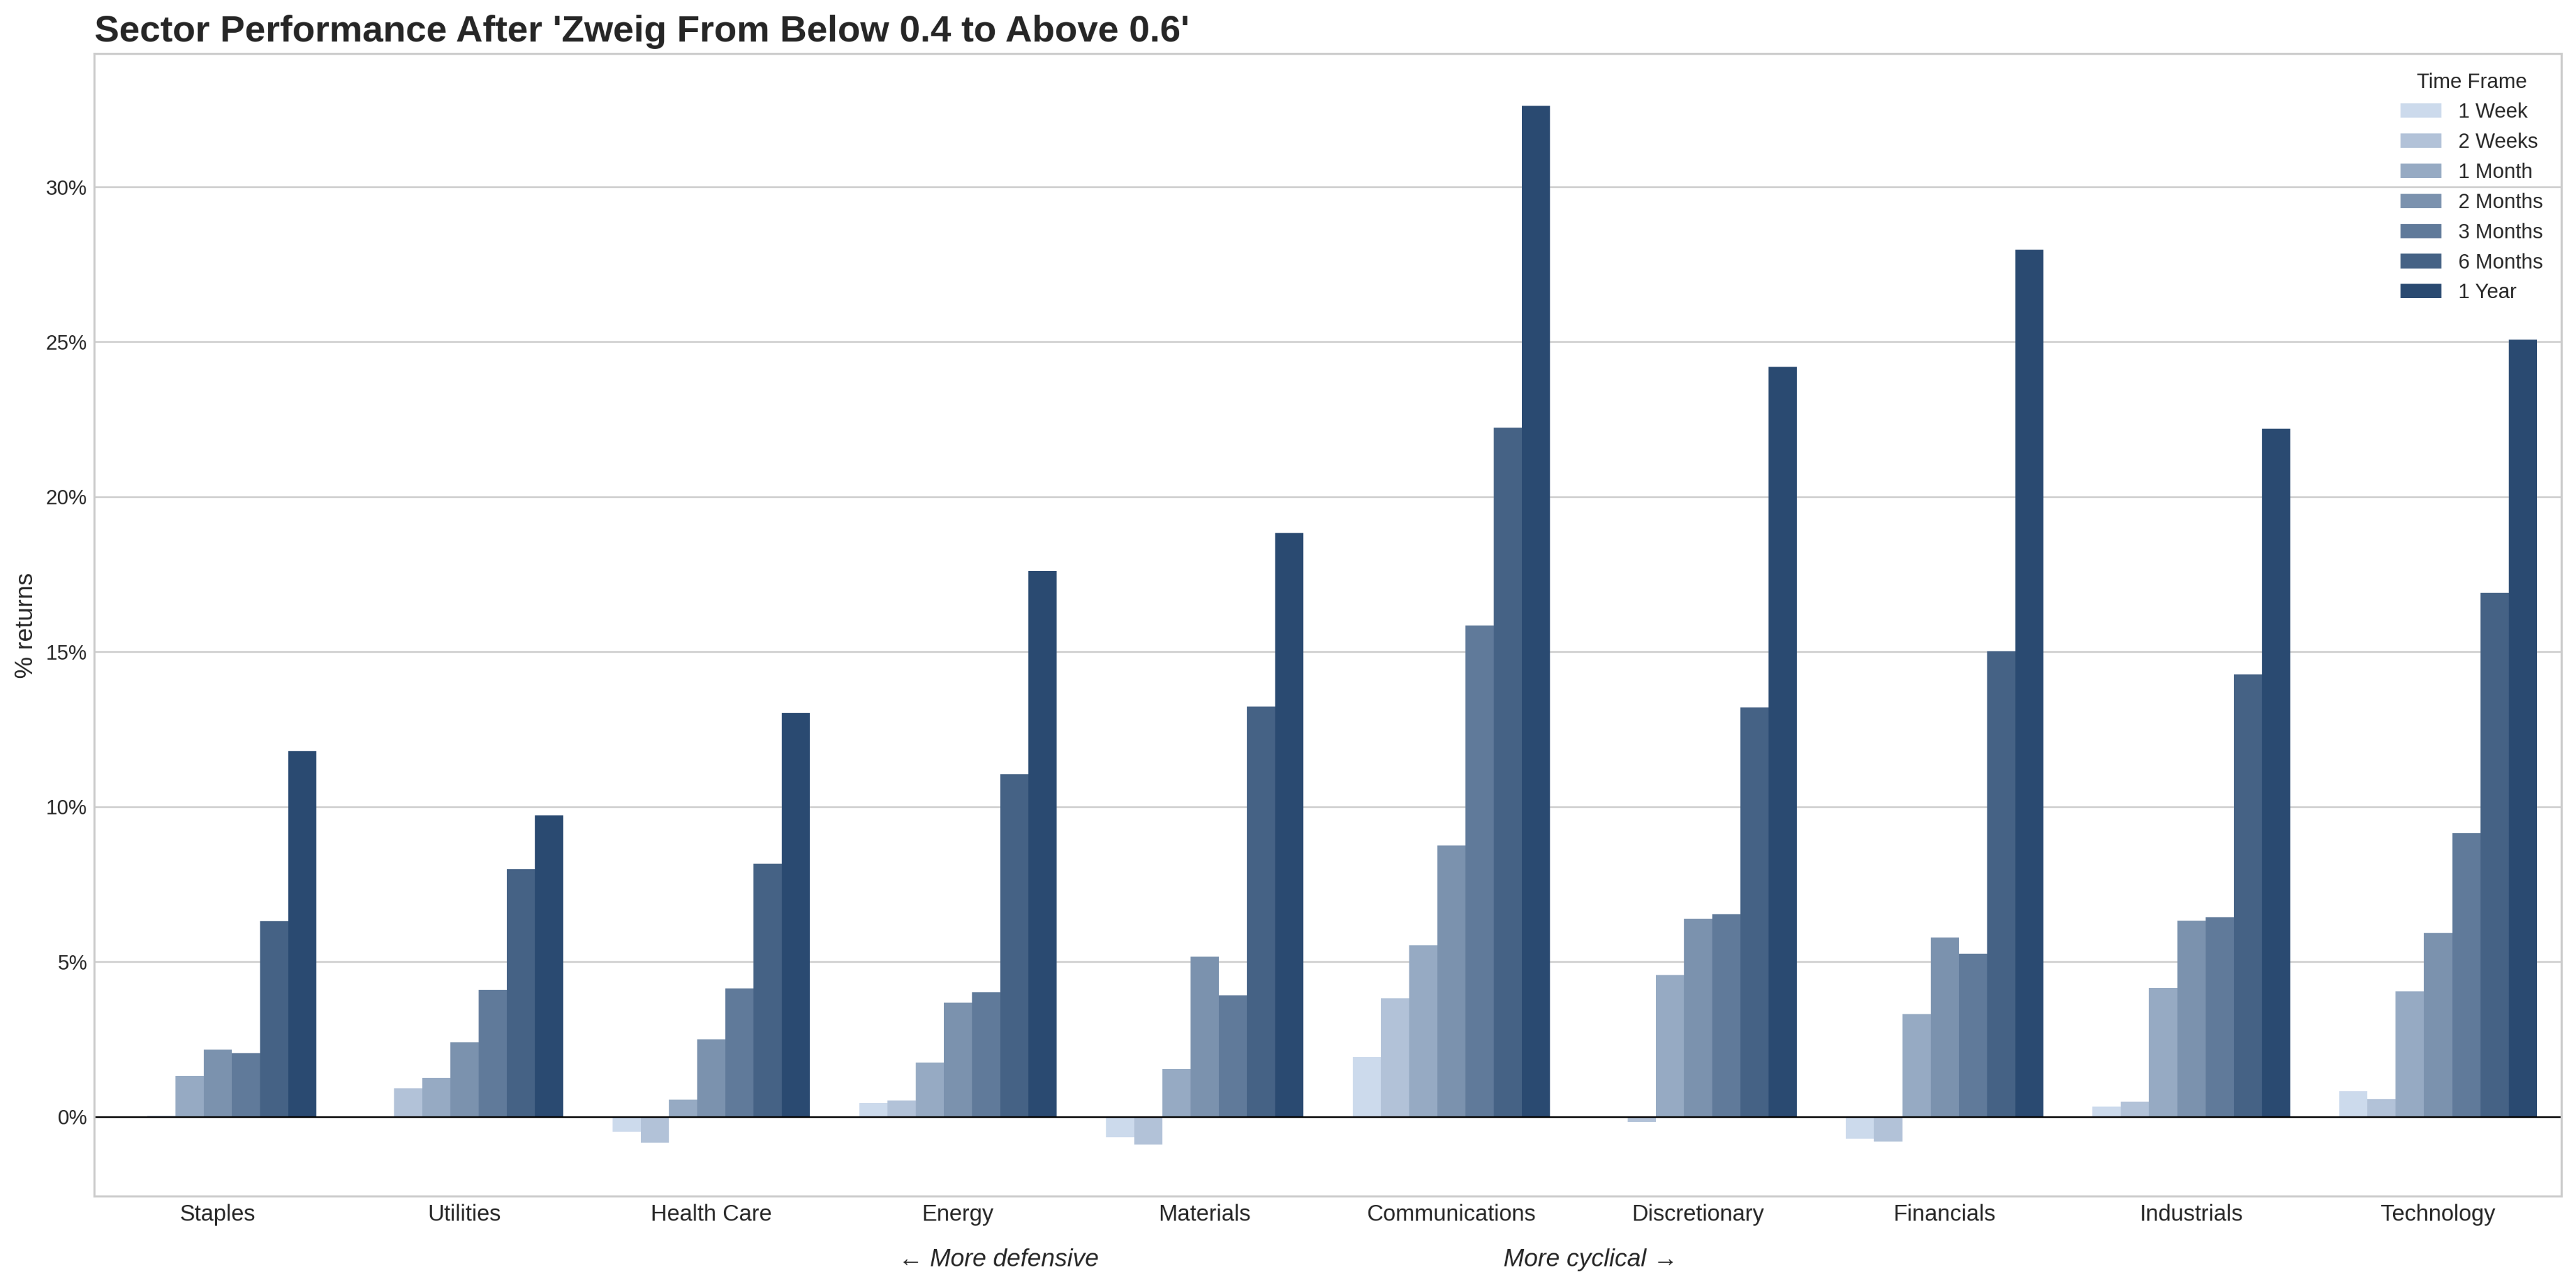
All sectors have delivered strong overall performance, with defensive sectors performing relatively weaker.
Similar Rebound in the McClellan Indicator
We turn to another momentum indicator for confirmation: the McClellan Oscillator.
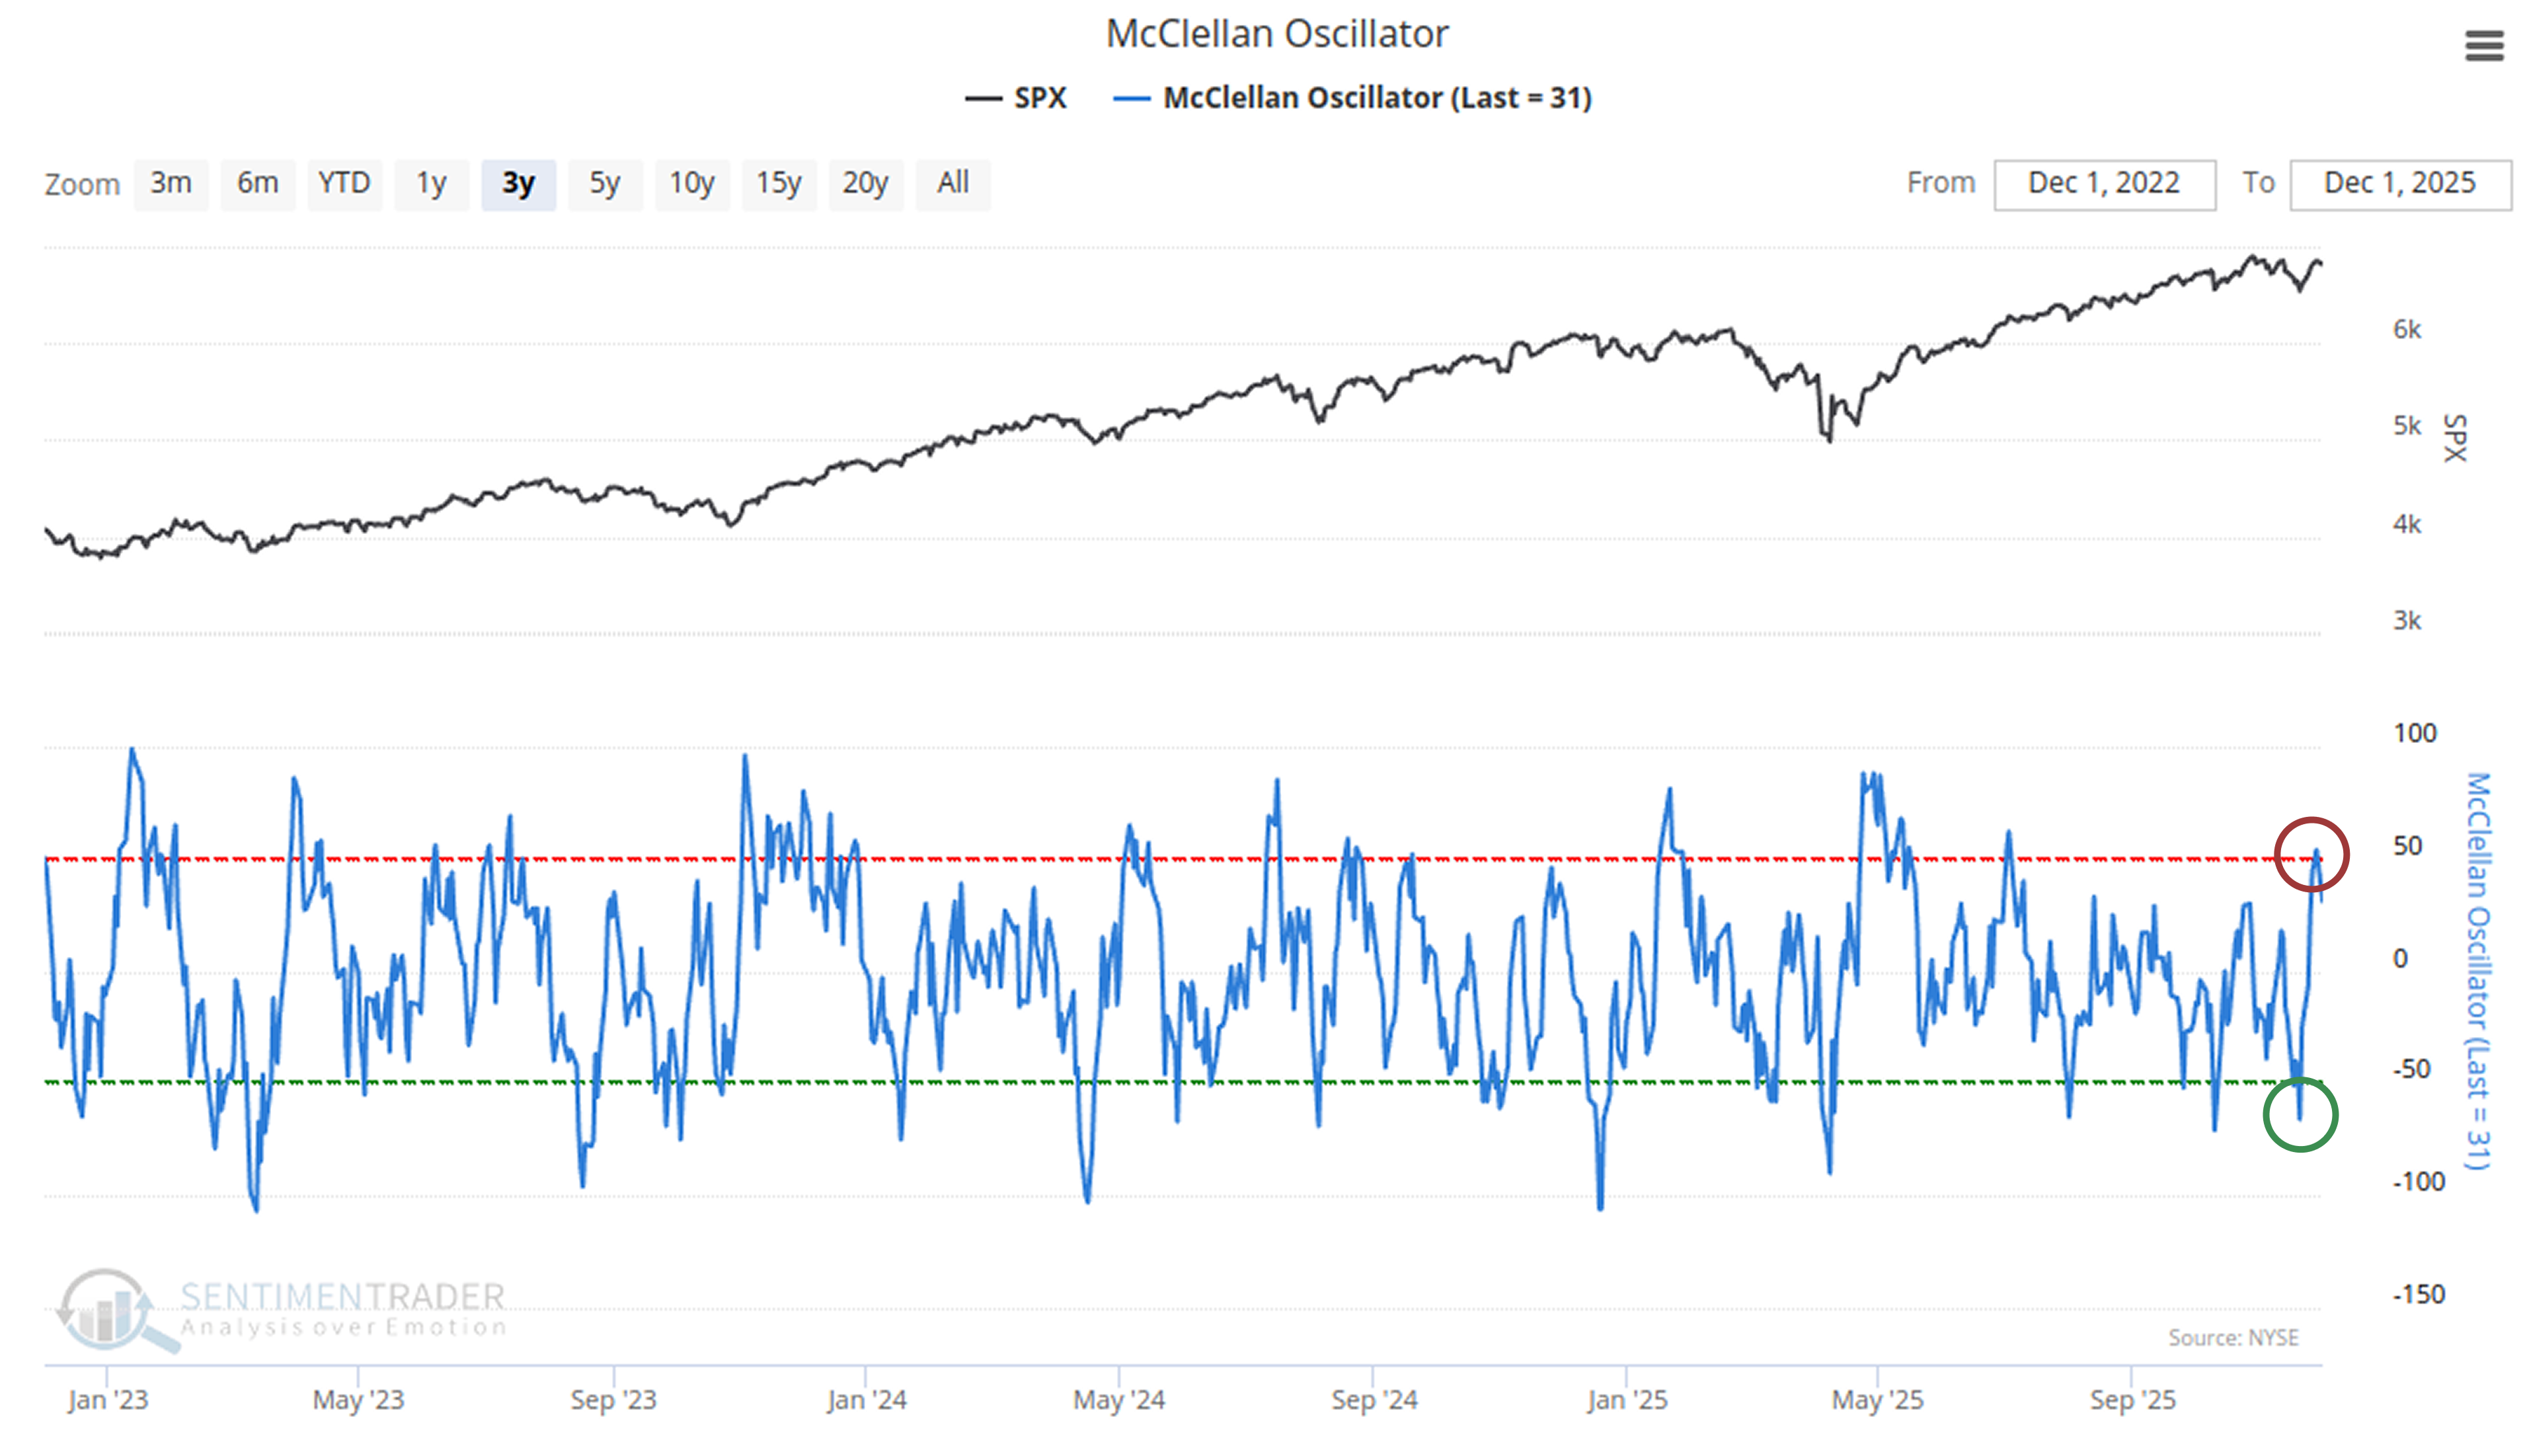
The current reading indicates a "moderate recovery". While the indicator has successfully returned to positive territory, breaking free from bearish control, it has not exhibited that "rocket-like" thrust. However, in instances where the value has moved from below -50 to above -50 within 10 trading days, its historical performance is as follows: Related Backtest Click Here.
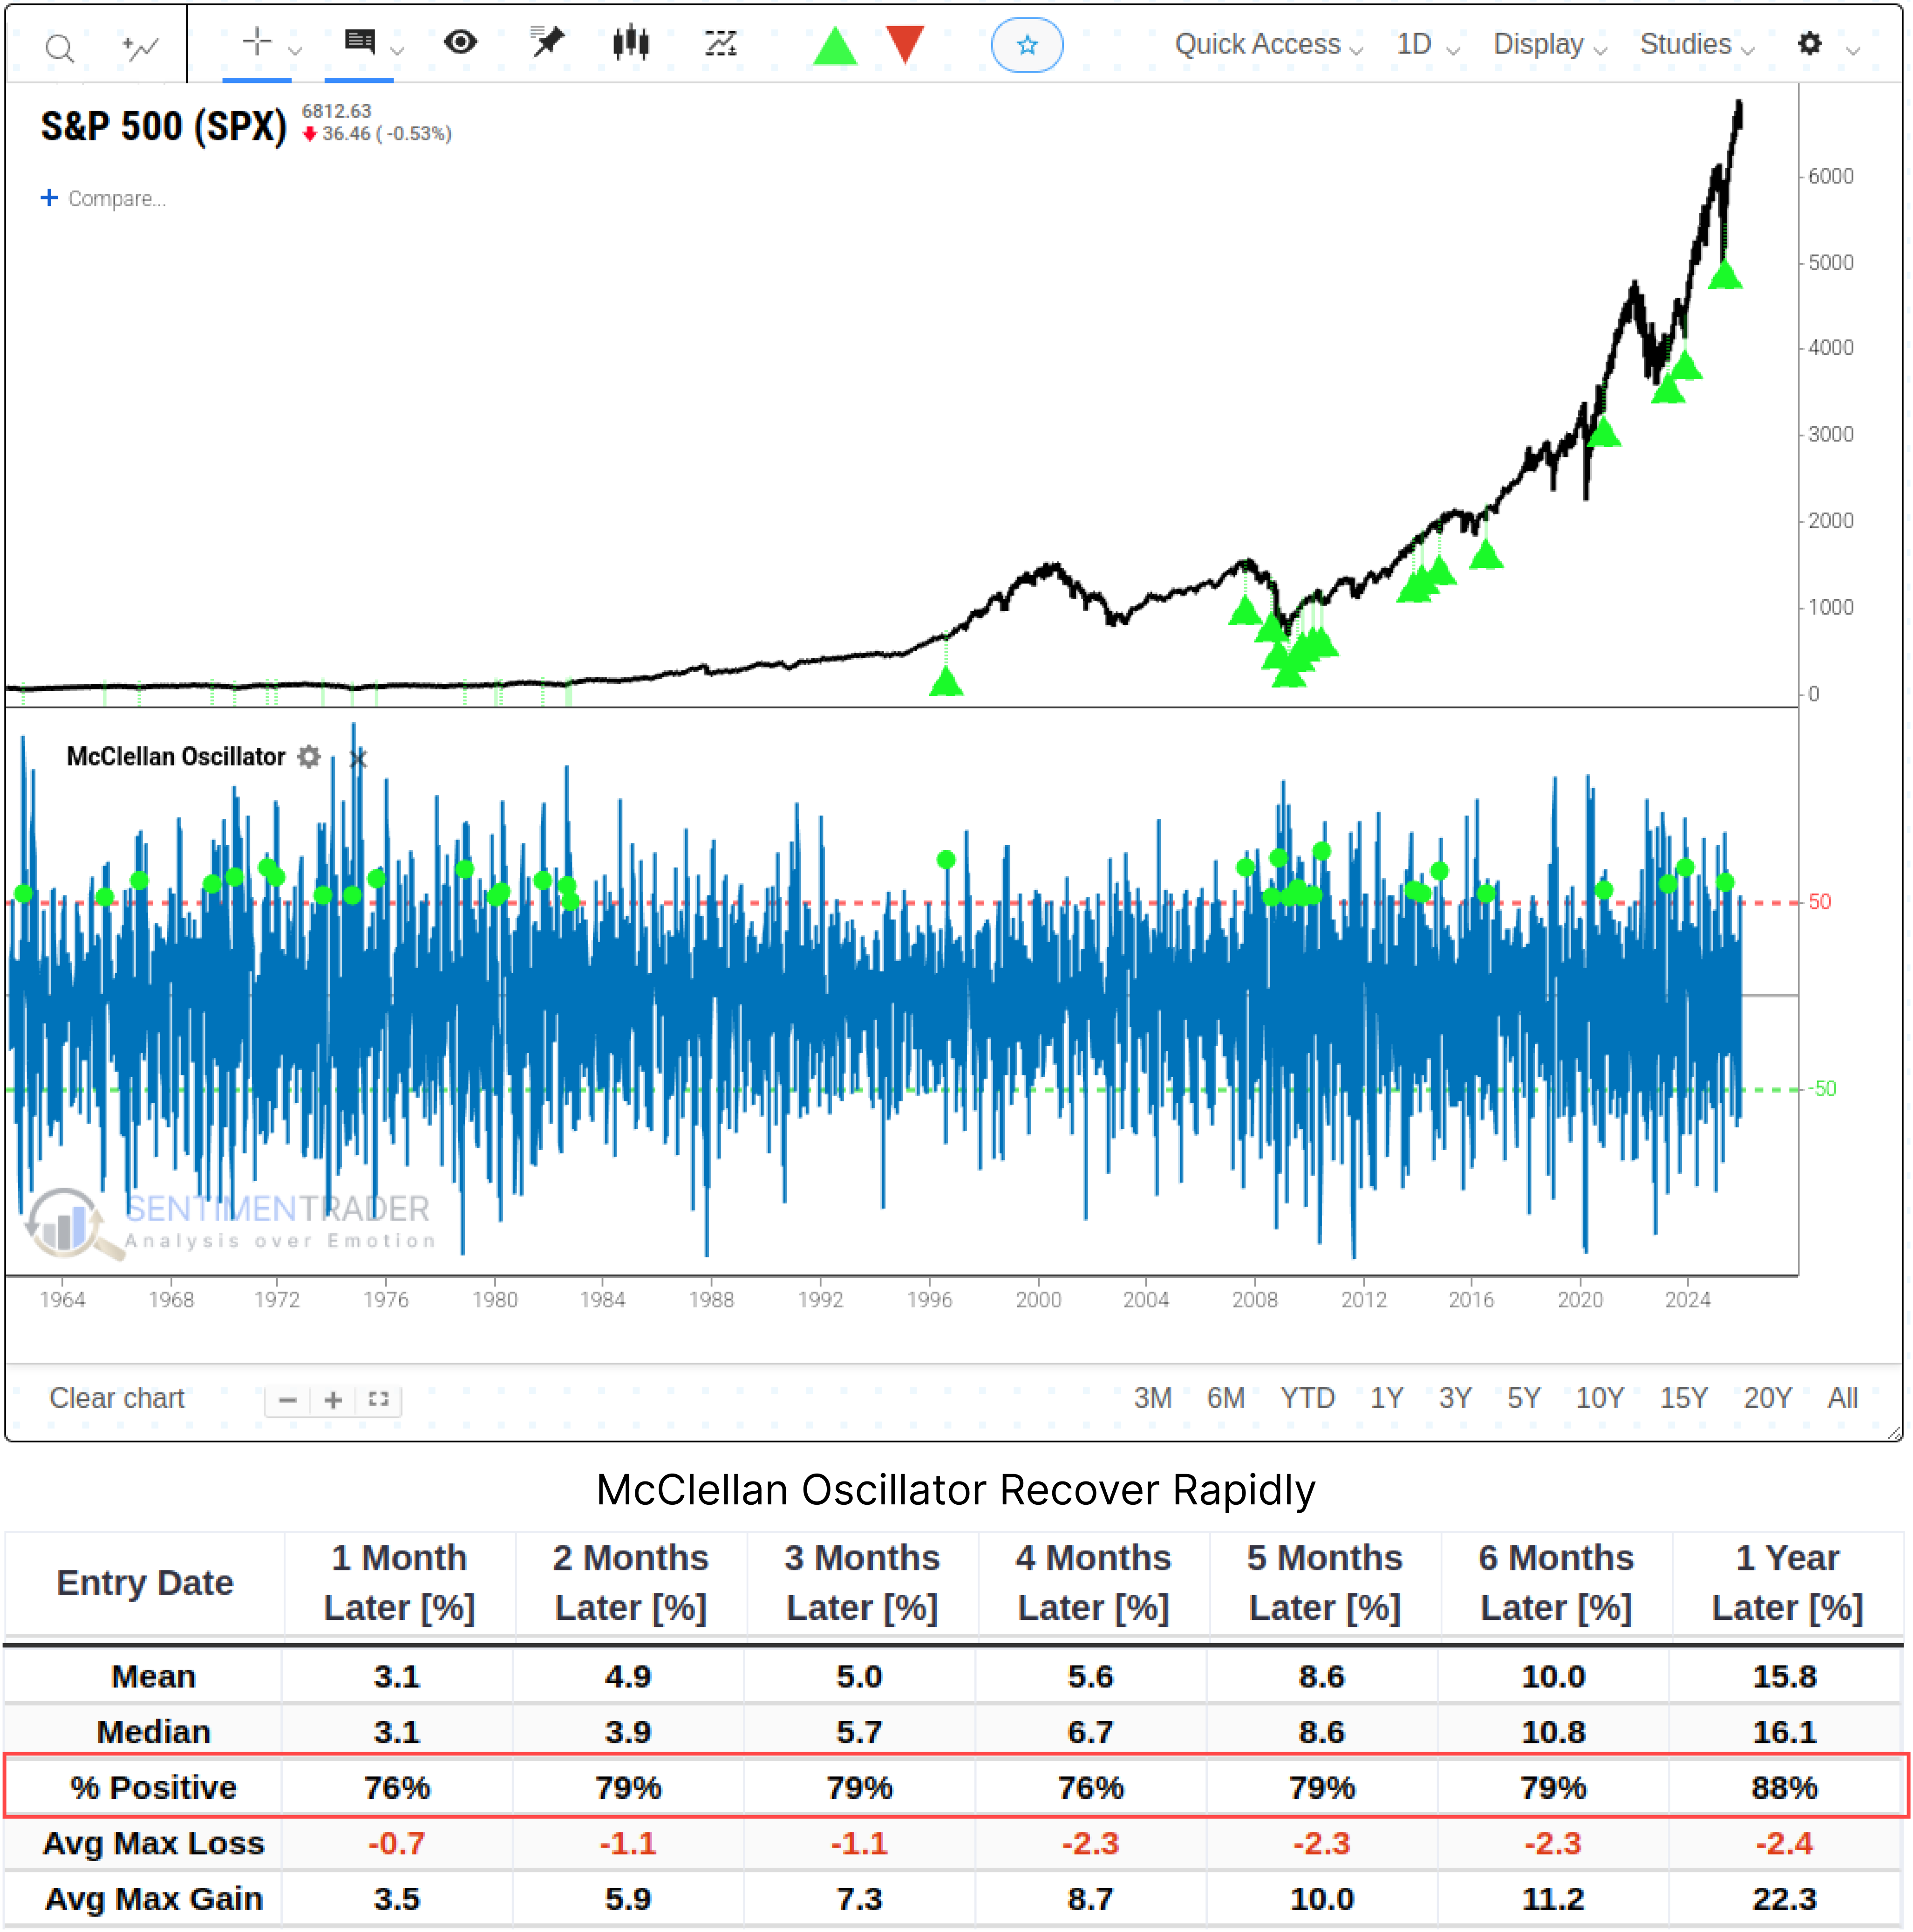
Data from the 33 historical signals that have occurred tells us that the reversal of the McClellan Oscillator is also a positive signal, with an average return of +15.8% after one year-though its explosive power and stability are slightly inferior to the Zweig indicator. Similar to the Zweig signal mentioned earlier, when both core breadth indicators issued invalid signals during the same historical periods (the 1970s and 2008), this significantly increases the likelihood that the current market faces similar systemic risks.
V-shaped Rebound in the Market
The recent price movement of the market is also distinctive, forming a V-shape.
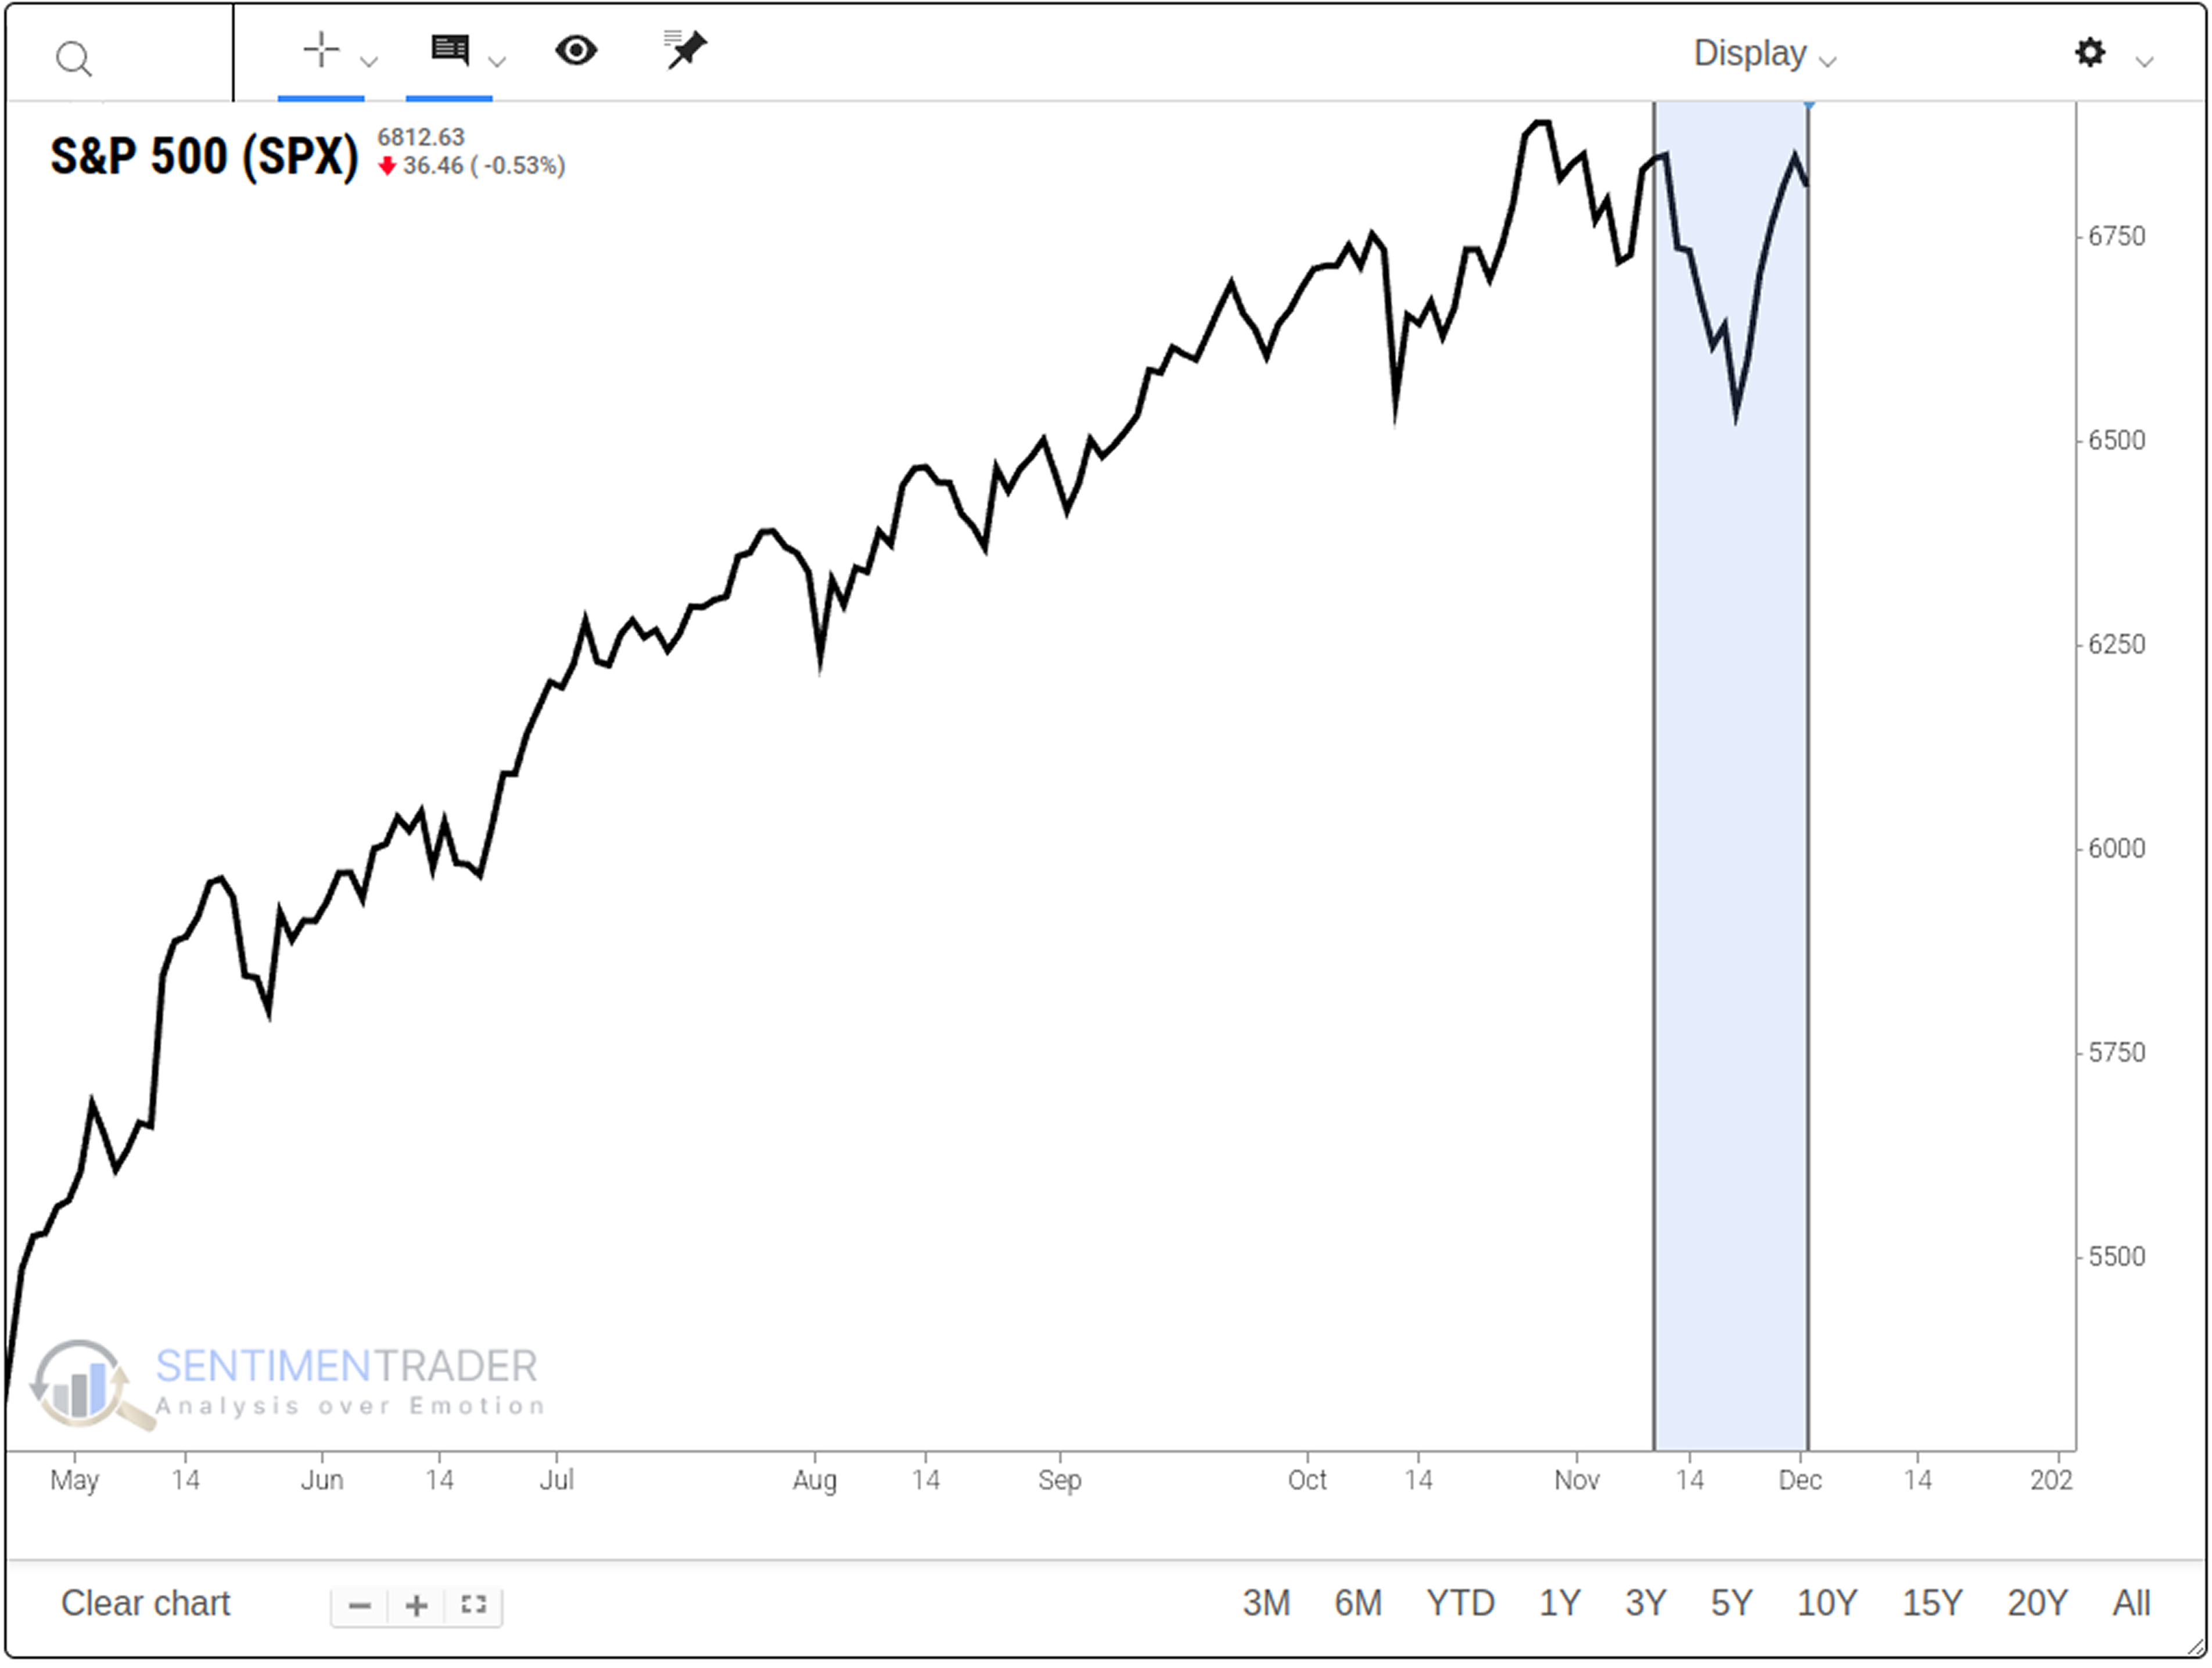
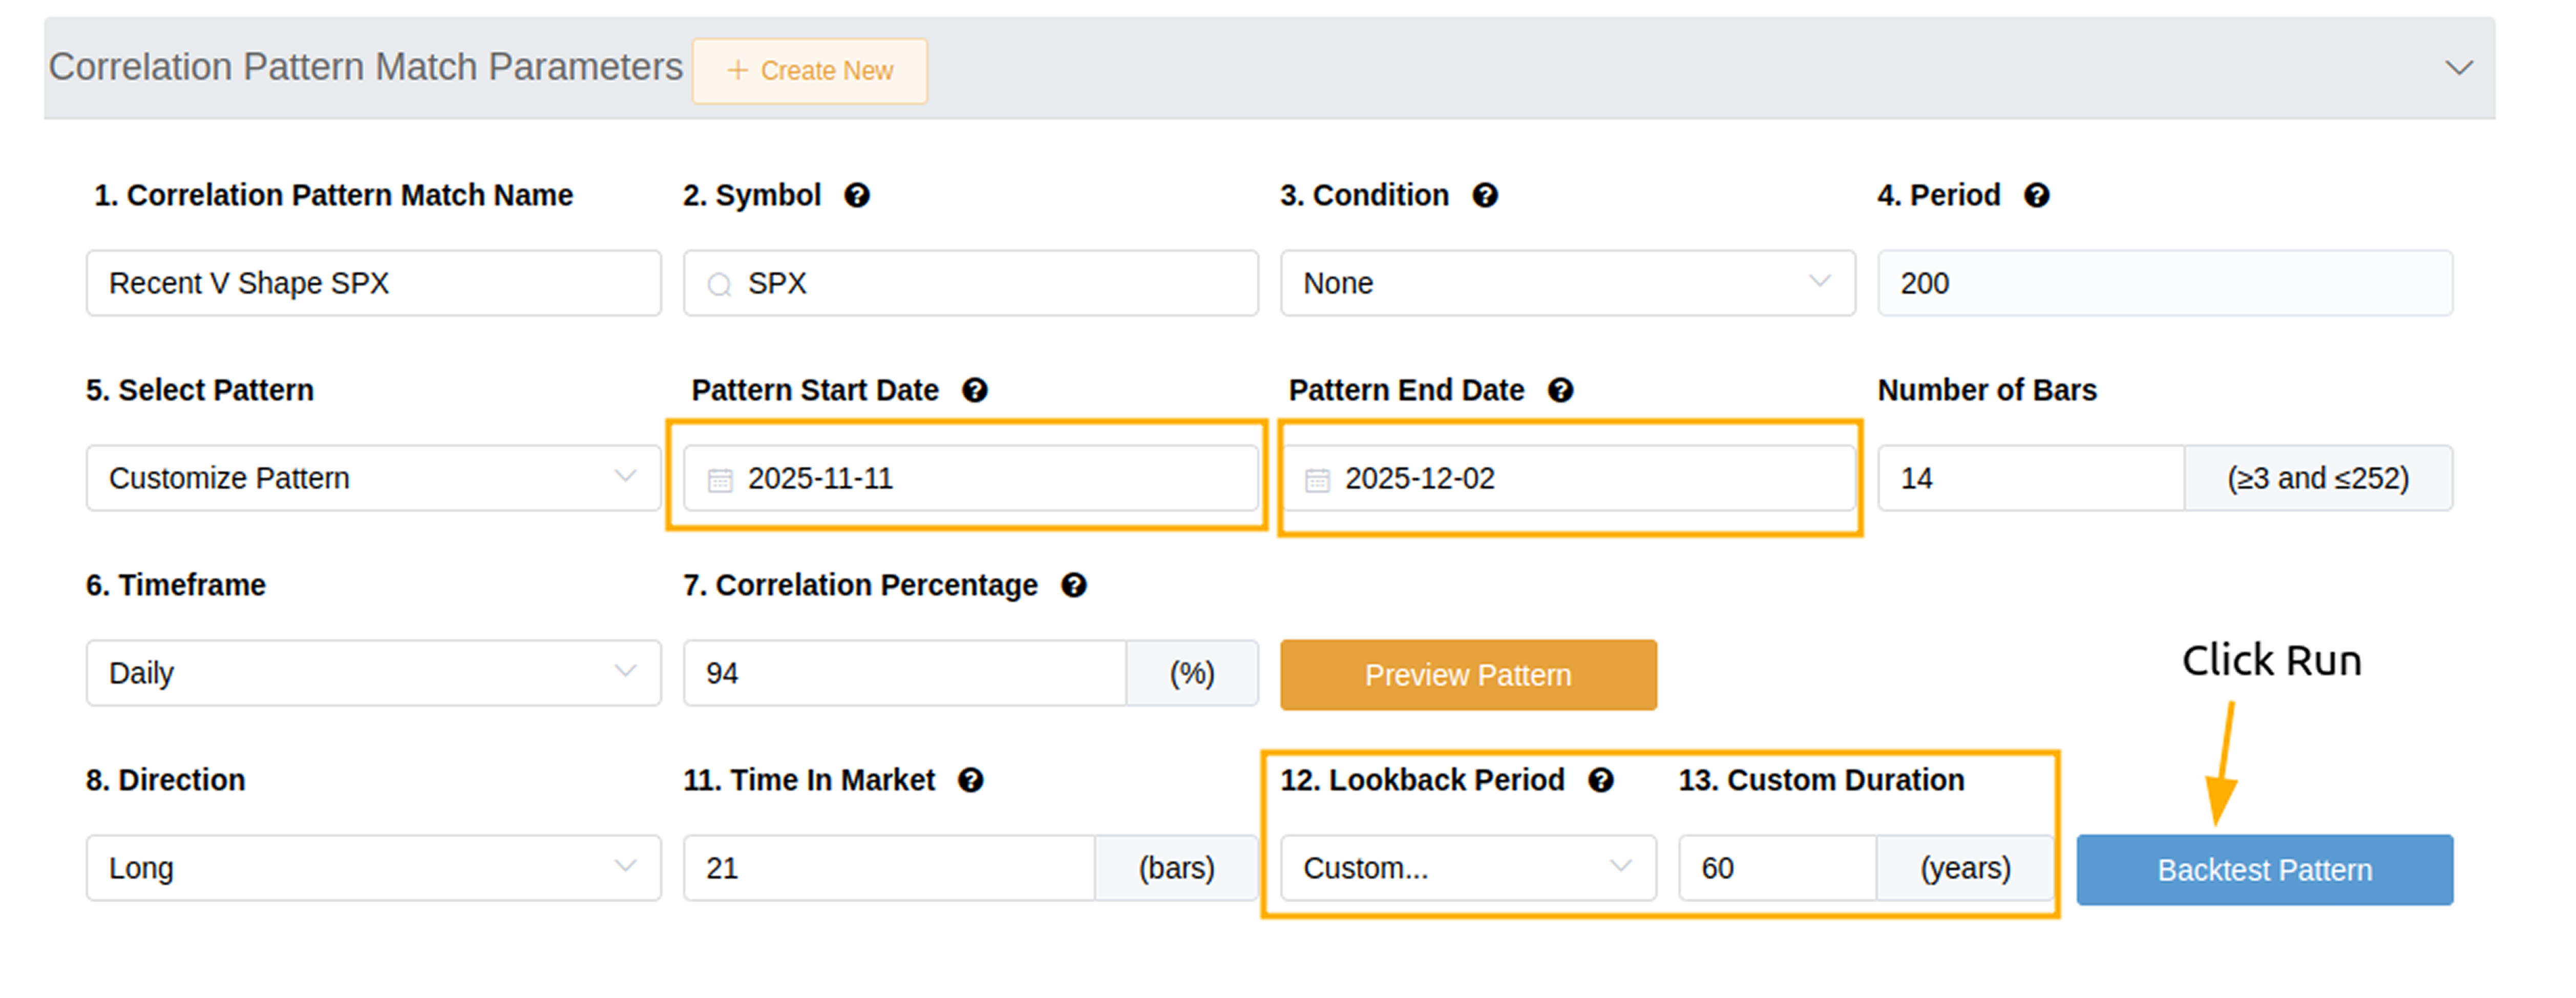
We conducted a search for matching similar pattern types in historical closing prices of this form, setting a similarity threshold of over 94% and a period of the past 60 years. The historical performance in corresponding scenarios is as follows:
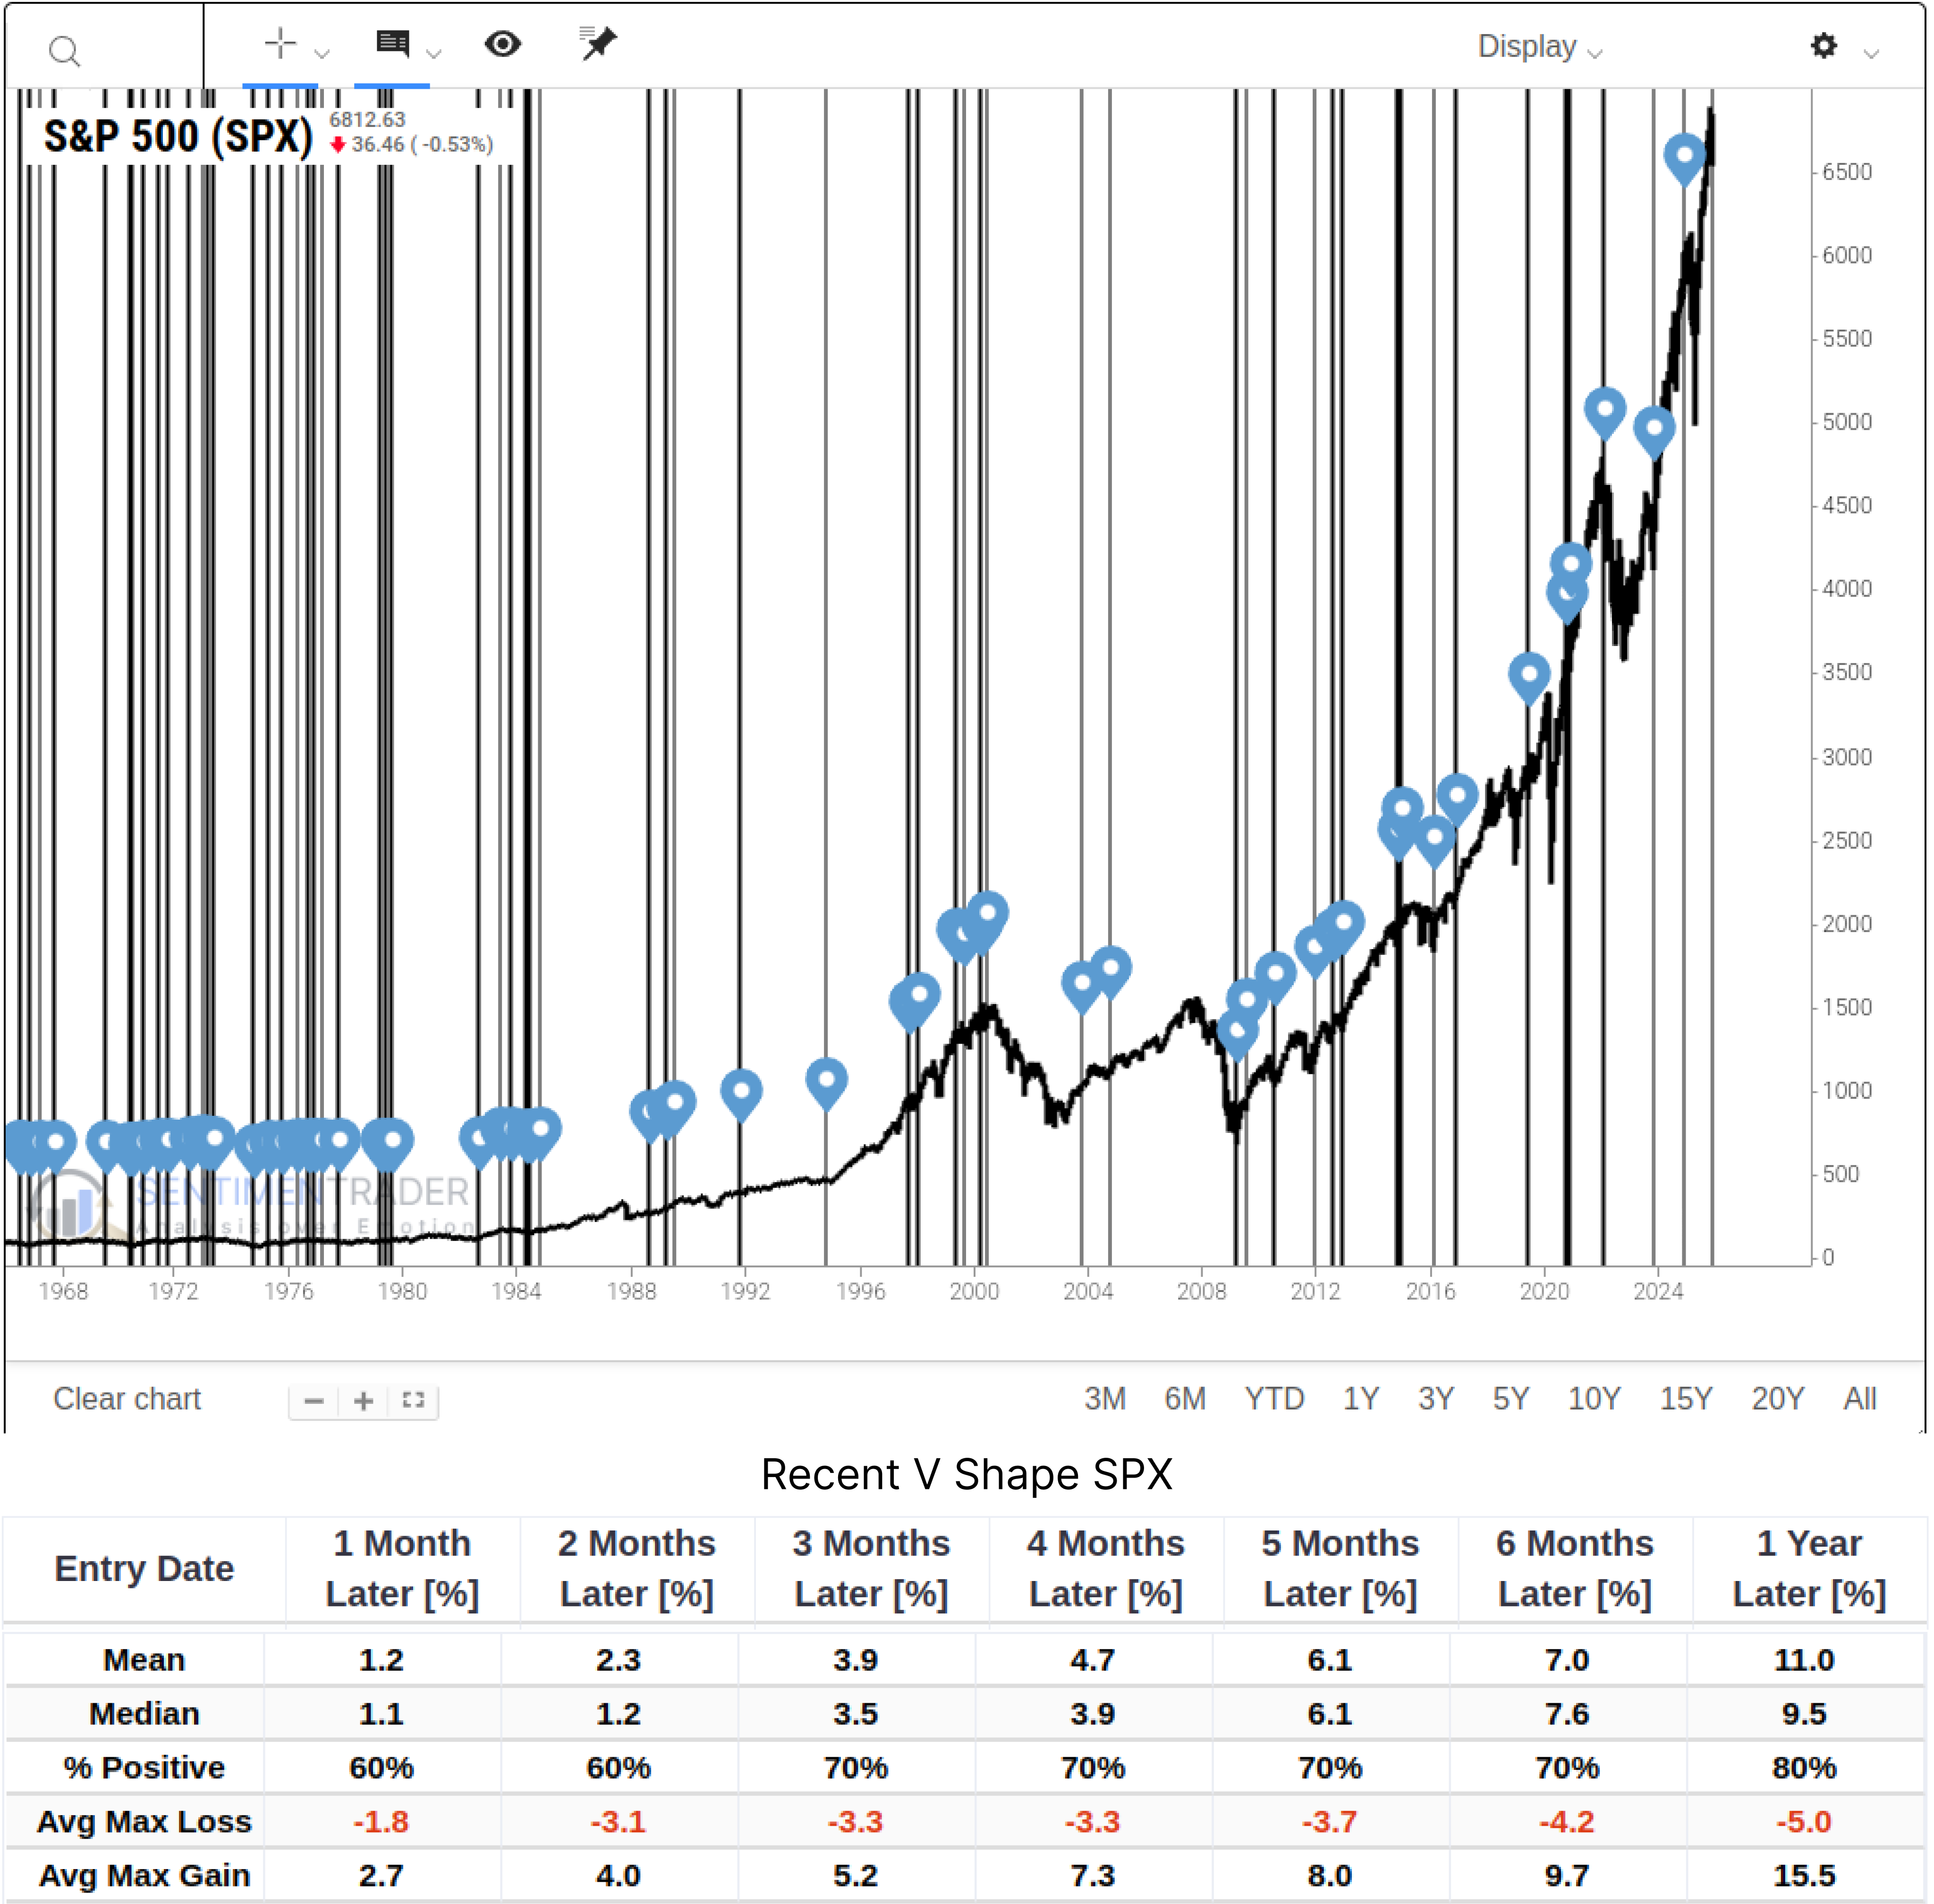
The data indicates that such a V-shaped rebound itself has strong momentum. Historical data shows that six months after pattern confirmation, the average return is +7%, and the average return after one year is +11%, with a historical win rate of 80%.
Of course, this does not mean the market will soar continuously. Simply from the perspective of price momentum, the path of least resistance is upward.
How to Create a CPM
Click on the section below on our website, and you will enter the page for creating a CPM backtest.
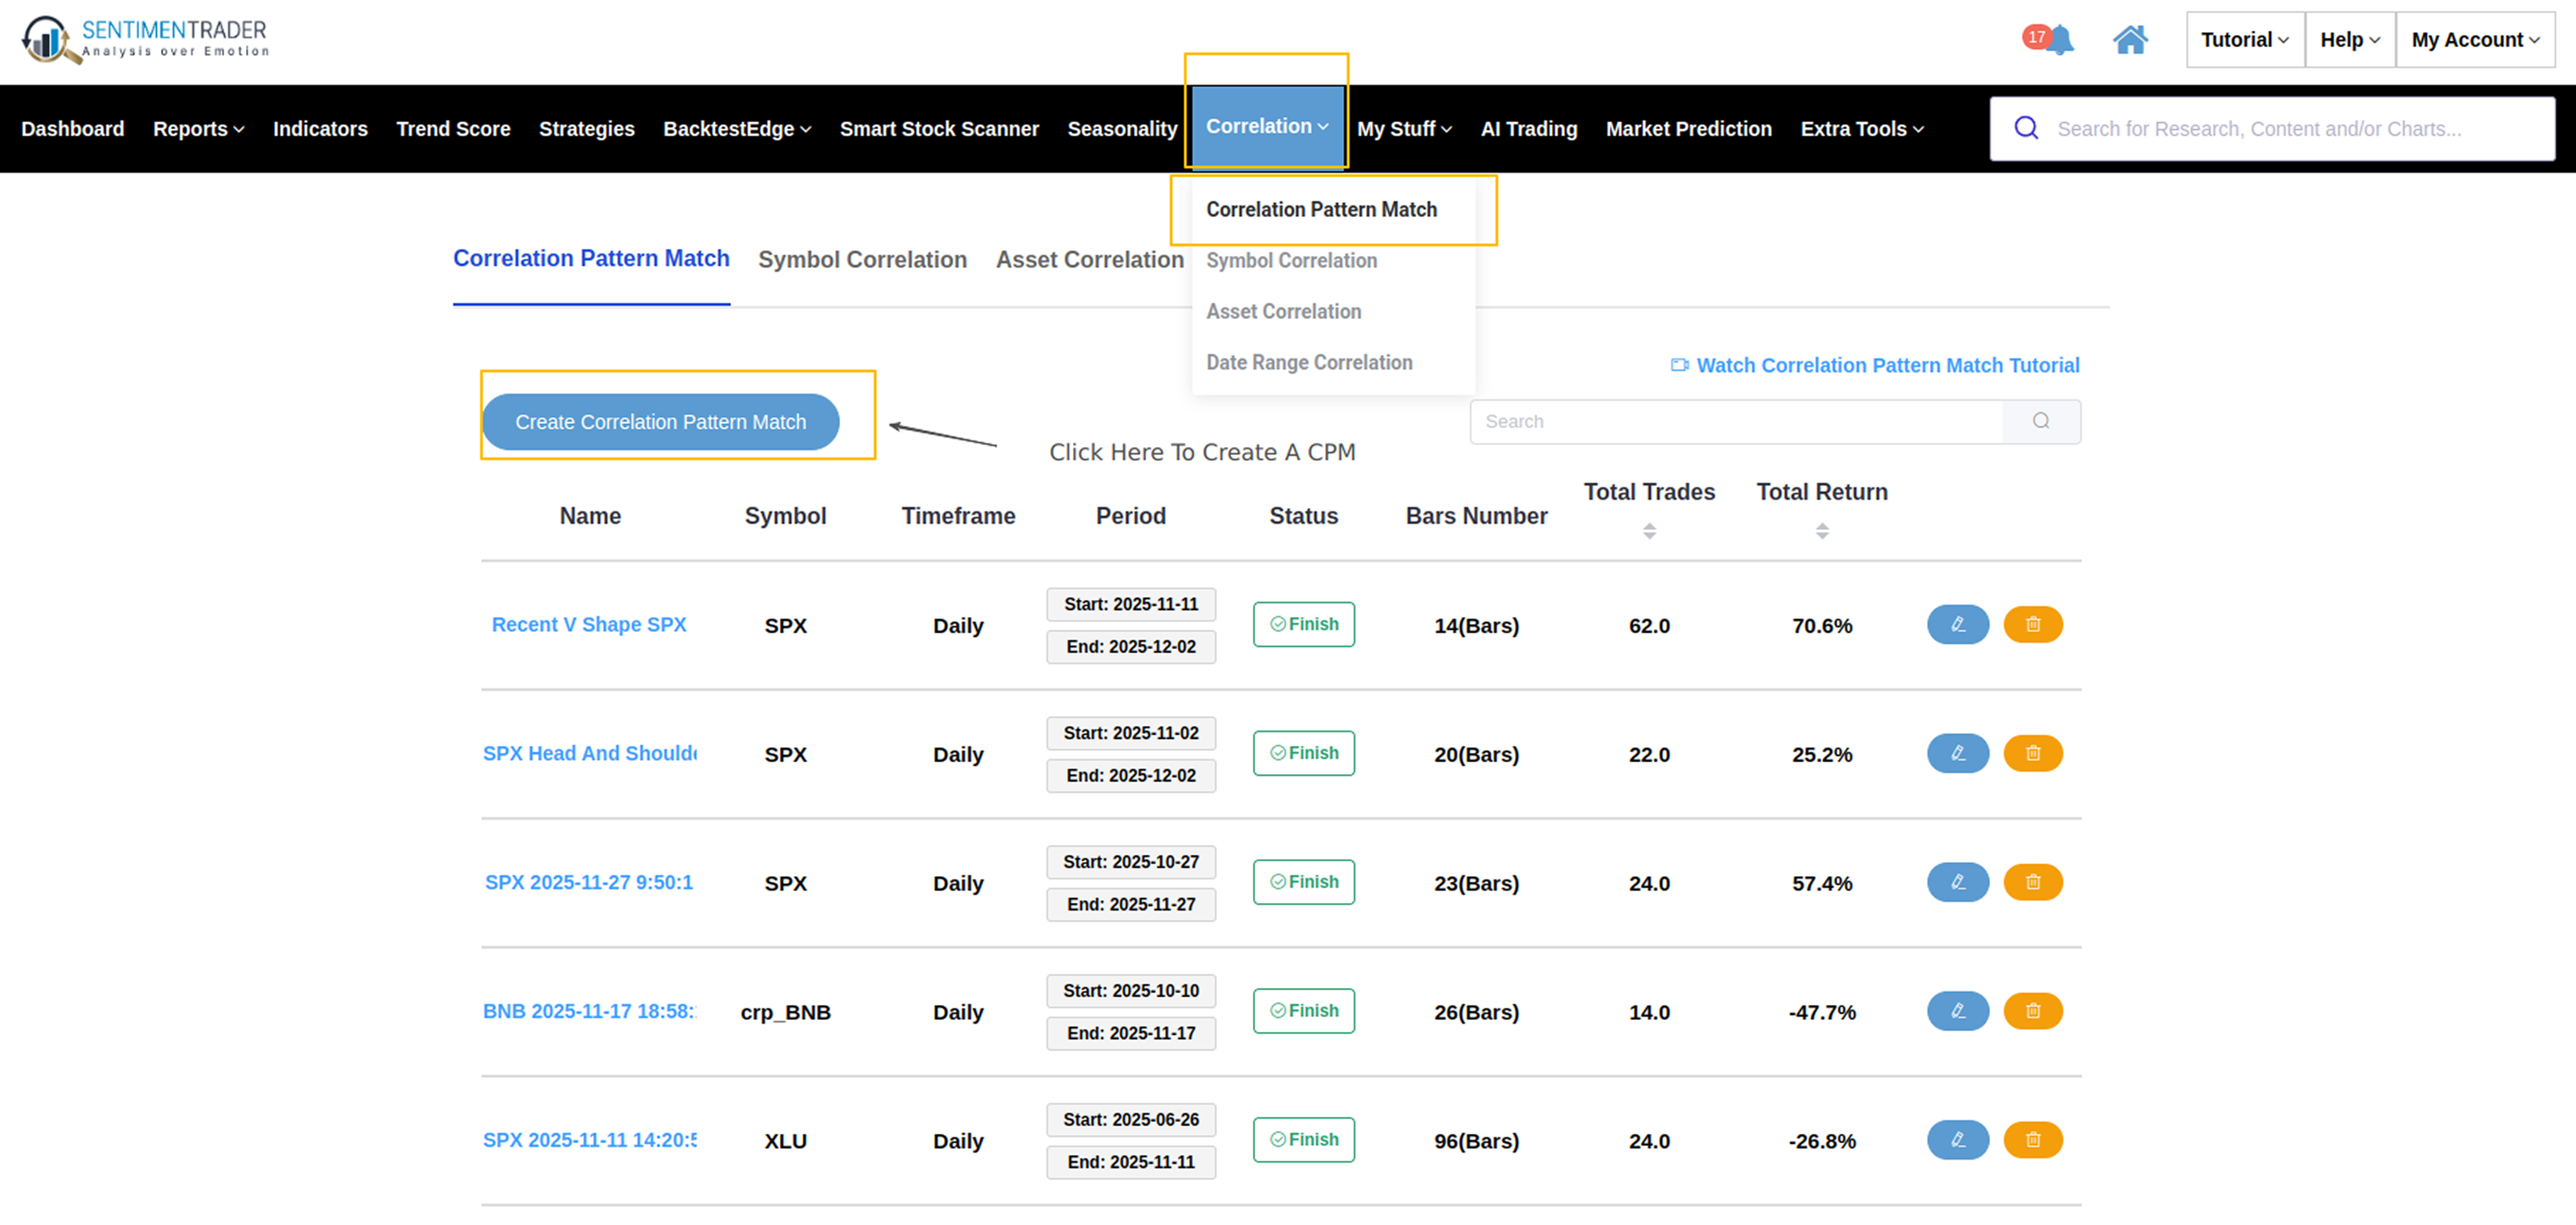
On the page, set the starting event point of the matching pattern, then set the historical length of the backtest to 60 years, and click to run.
What the Research Tells Us
The recovery of the Zweig Breadth Thrust indicator and the other two indicators suggest that the market has shown signs of repair but lacks explosive power.
The Zweig indicator rebounded rapidly from <0.40 to >0.59 within 10 trading days; while not reaching an extreme, it also demonstrated the weakness of selling pressure. More importantly, this recovery was accompanied by corresponding sector rotation, with defensive sectors performing slightly worse.
From historical data, this combination of "V-shaped rebound plus breadth repair" often signals the continuation of upward momentum. Historical backtests show that after the establishment of similar patterns, the S&P 500 Index has an 80% probability of rising over the subsequent 12 months.
Therefore, under the combined effect of the three signals, both price momentum and sector rotation point to the same direction. For traders, as long as prices remain above key moving averages, the path of least resistance is still upward.