
Yields, inflation and the S&P 500

Key points
- Real yield, in simple terms, is the return on an investment after accounting for inflation
- The lack of positive real yield can be a significant warning sign for investors
- At the moment, real yield remains favorable for stock investors
The components of real yield
We consider "real yield" to be the difference between the yield on a 10-year treasury note and the 12-month change in the Consumer Price Index, i.e., raw yield minus the inflation rate.
For our test, we will use the 12-month percentage change in the Consumer Price Index (CPI) as our measure of inflation. We will also examine the difference between the 10-year treasury yield and inflation as a measure of "real yield."
To wit:
- A = Consumer Price Index reading for the most recent month ended
- B = Consumer Price Index reading for 12 months prior
- C = ((A / B) -1) *100
- D = 10-year treasury yield for the most recent month ended (ticker TNX or $TNX)
- E = D - C
We will perform these calculations only at the end of each calendar month. So, for example, at the end of May 2025:
- A = 320.3210
- B = 313.2070
- C = 2.271 <<<<<<< Inflation rate
- D = 4.416 <<<<<<< 10-year yield
- E = 2.1447 (4.416 - 2.271) <<<<< Real yield (10-year yield - inflation rate)
For our trigger, we will use a cutoff of -0.60. So the question at the end of each month is simply this: Is the "real yield" (i.e., Value E) above -0.60?
The chart below displays the month-end value for Variable E starting at the end of 1919. The horizontal blue line is our -0.60 cutoff.
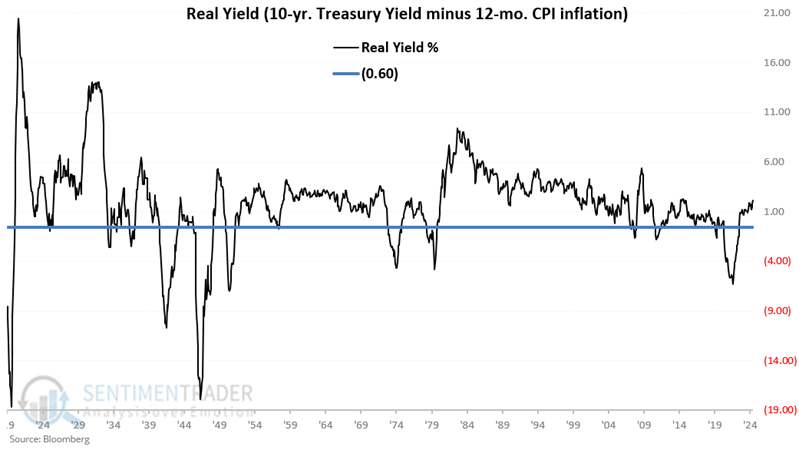
Readings above the blue horizontal line at -0.60 are considered "Favorable" for stocks. Readings below the blue horizontal line at -0.60 are considered "Unfavorable" for stocks.
Trading Rules
For the record, the model detailed below is not intended to be used as a standalone investment model, but rather as "weight of the evidence" regarding inflation and how it sometimes impacts stock prices.
Real Yield readings below -0.60 suggest an "abnormal" environment (i.e., inflation is outstripping yields). To account for this fact, we adopt the rules below.
If at the end of the current month, Value E is:
- Greater than -0.60 (i.e., if the "Real Yield" of 10-year treasury yield minus CPI 12-month inflation is greater than -0.60) then buy stocks
- Less than or equal to -0.60, then sell stocks
We will use the S&P 500 as our proxy for "stocks."
S&P 500 results based on Real Yield fluctuations
The chart below displays the hypothetical growth of $1 (on a logarithmic scale) invested in the S&P 500 only if the Real Yield is above -0.60.
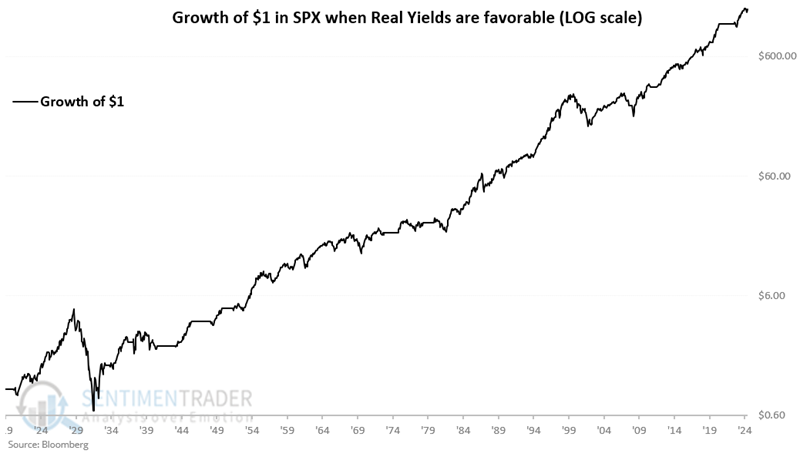
The hypothetical cumulative gain from 1919-12-31 through 2025-05-31 is +148,068%.
Conversely, the chart below displays the hypothetical growth of $1 invested in the S&P 500 only if the Real Yield is -0.60 or lower.
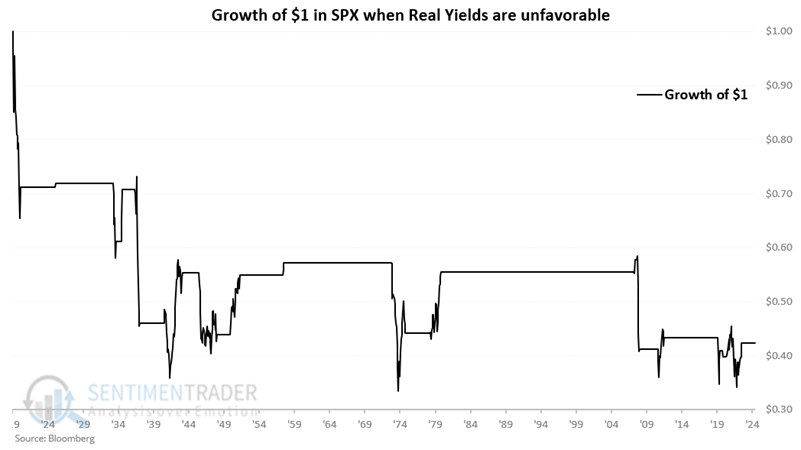
The hypothetical cumulative loss from 1919-12-31 through 2025-05-31 is -57.6%.
The table below displays S&P 500 performance during favorable and unfavorable periods based on the above-mentioned trading rules.
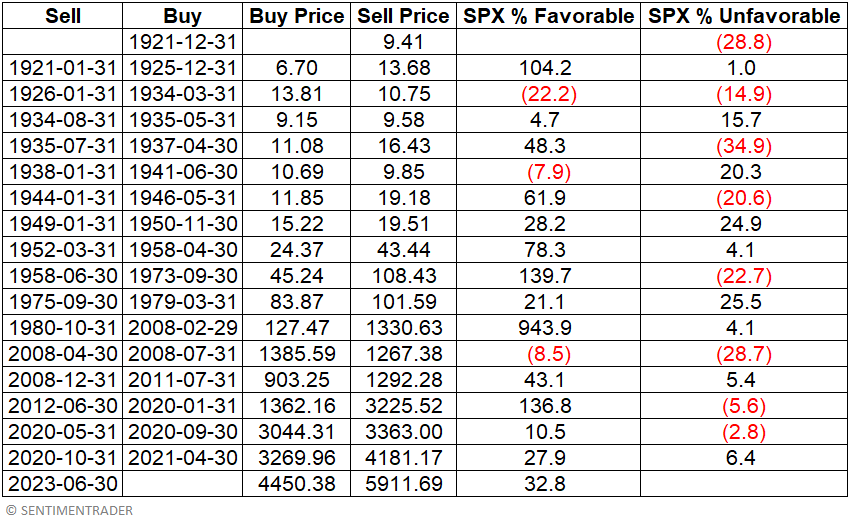
The table below summarizes the results.
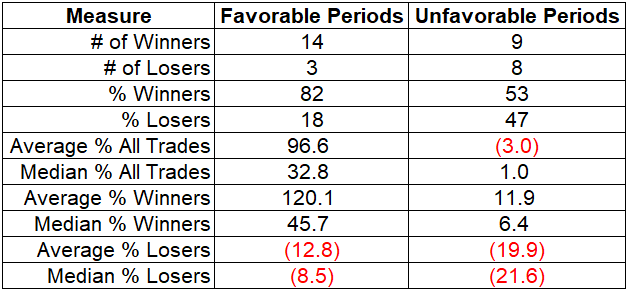
Key things to note in the table above:
- % Winners: 82% during Favorable periods versus 53% for Unfavorable periods
- Median % All Trades: 32.8% for Favorable periods versus 1.0% for Unfavorable periods
- Median % Losers: A median loss of -8.5% during Favorable periods versus -21.6% for Unfavorable periods
Where are we now?
The model has been favorable since 2023-06-30. As we showed above, at the end of May 2025, the Real Yield was +2.14%, so this model remains favorable for stocks.
What the research tells us…
Inflation is an important factor that can significantly affect the investment environment. While extremely high inflation (or deflation) can negatively impact stocks, comparing inflation to current yields can give us another way to contextualize current inflation. While there has been much consternation regarding rising interest rates and inflation, this model, which incorporates both, remains favorable for stocks.