
Yields cycle from an uptrend to a downtrend

Key points:
- The percentage of Treasury yields above their 200-day average cycled from 100% to 0%
- After similar reversals, yields declined across most time frames consistently
- Stocks were a little soft in the next few weeks but then recovered and enjoyed healthy returns
Treasury yields cycle from an uptrend to a downtrend
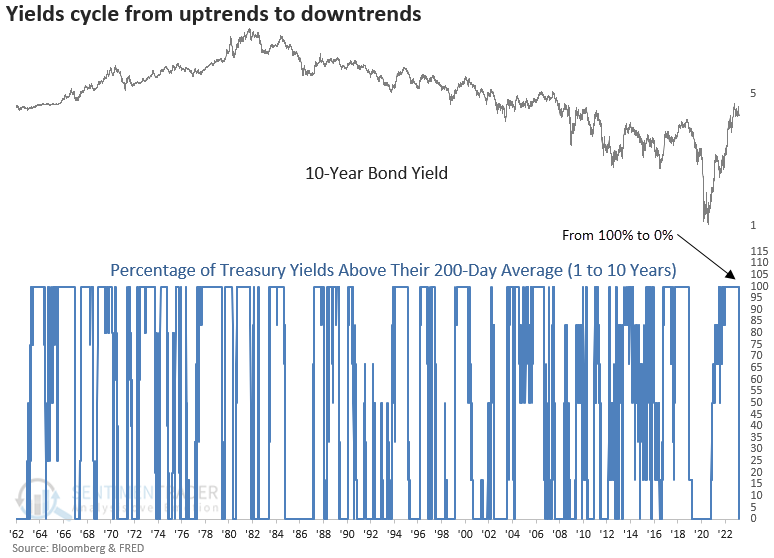
For the first time since 2019, the percentage of Treasury yields (1 to 10 years) above their 200-day average cycled from 100% to 0%. The abrupt trend reversal occurred in only one session, which had never happened before now.
Let's assess the outlook for interest rates and stocks when the percentage of Treasury yields above their 200-day average cycles from 100% to 0%. To isolate historical precedents like now, I will include a condition requiring the 10-year yield to close at a 2-year high before a new alert can trigger again.
Similar Treasury yield trend reversals led to lower interest rates
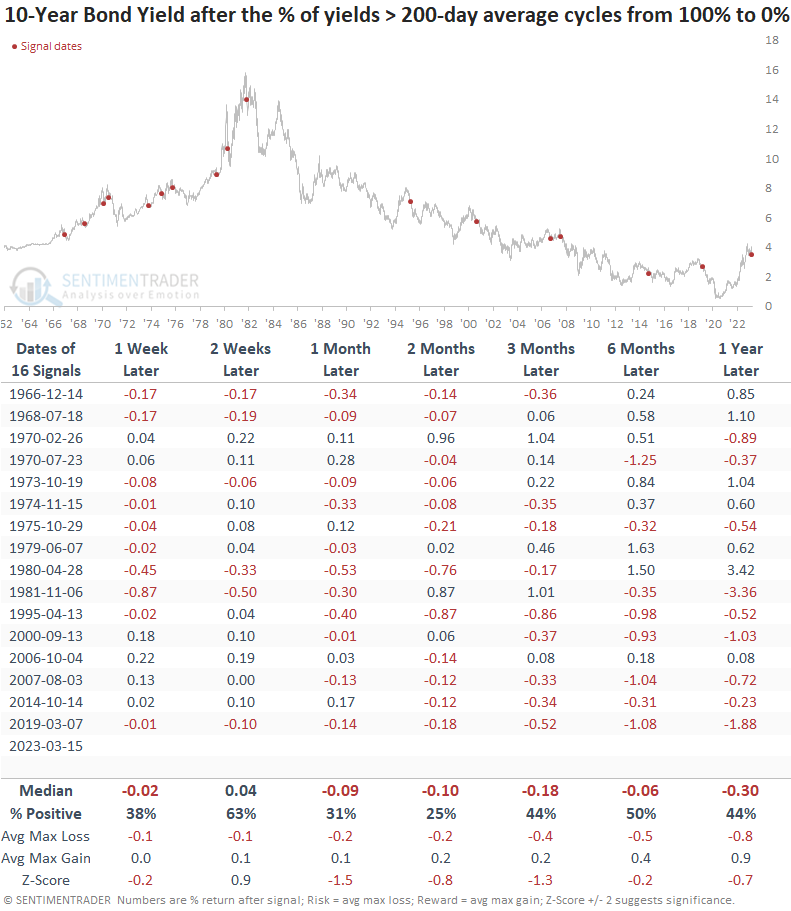
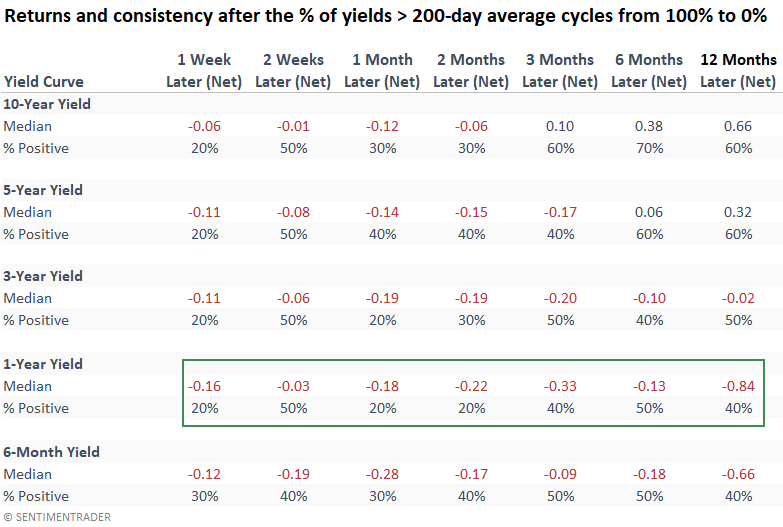
When the percentage of Treasury yields above their 200-day average cycles from 100% to 0%, the 10-year yield showed a fairly consistent downward bias. Over the next two months, the 10-year declined 75% of the time.
Interestingly, more than half of the signals occurred in a rising rate environment (1966-82), which also marked a secular bear market for equities.
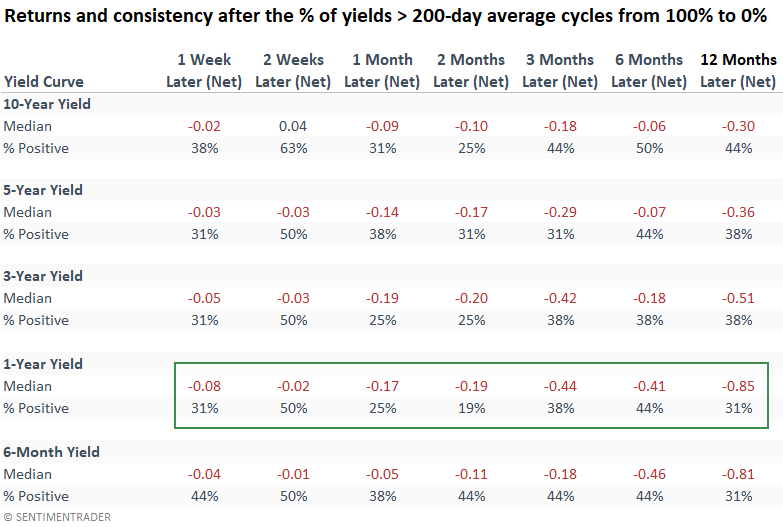
Suppose you're wondering where you might get the best bang for the buck across the curve. In that case, the 1-year T-Bill looks like a solid choice, with the yield falling 81% of the time over the next few months.
How did the signals perform during a rising rate environment
If you're concerned that we're in a higher-for-longer rate environment due to sticky inflation, similar to the 1966-82 period, the 10-year yield tended to fall over the next few months despite a secular uptrend in interest rates.
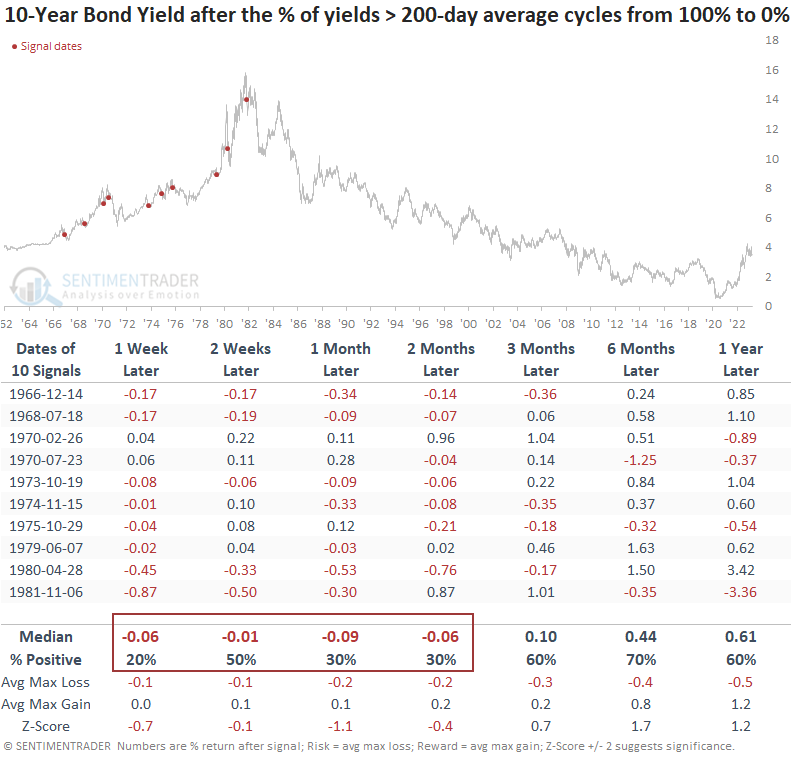
Once again, the 1-year T-Bill provided the best outcome across the curve despite the increase in yields from 1966 to 1982.
How do stocks react to a trend reversal in yields
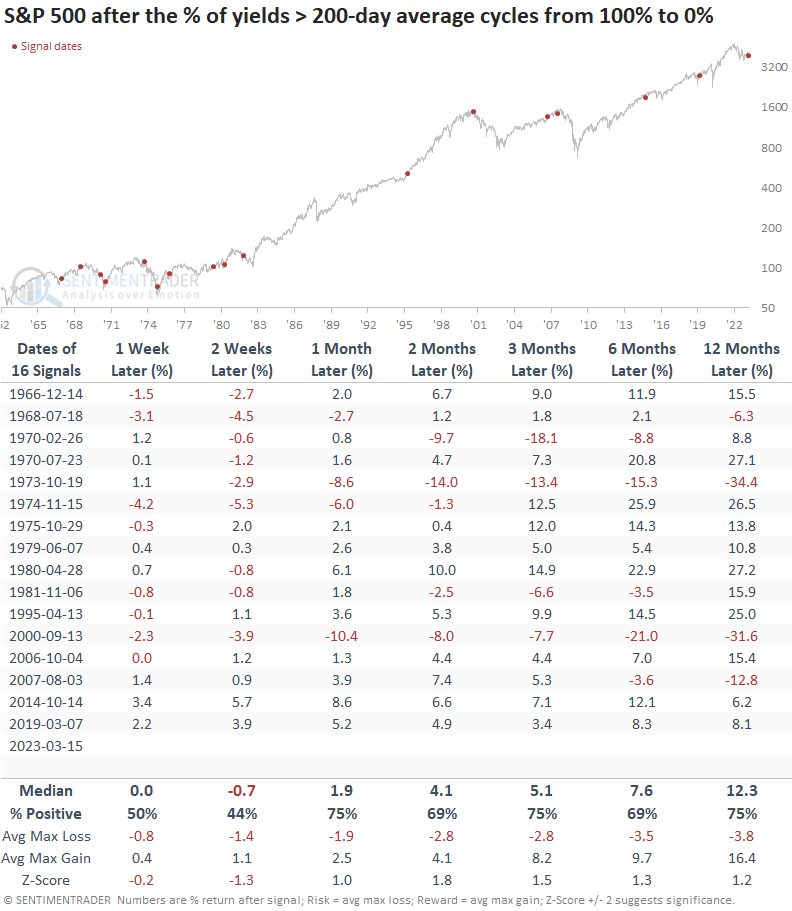
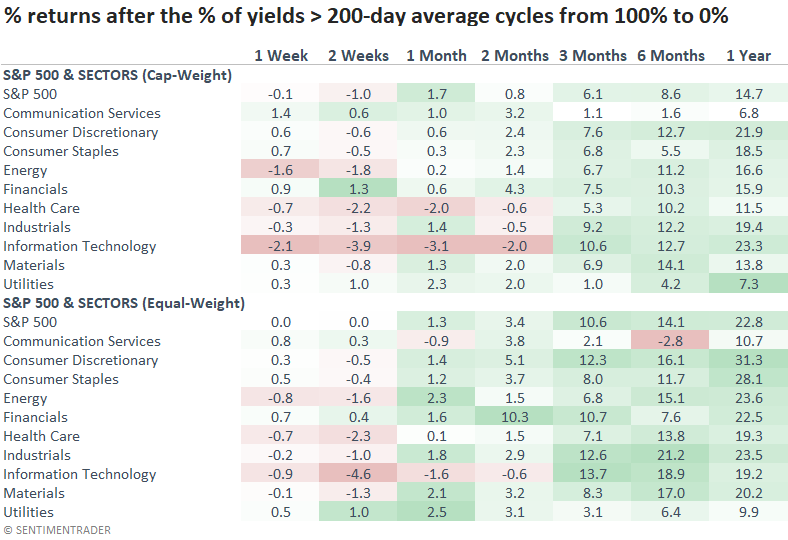
When yields reverse from an uptrend to a downtrend, the shift tends to produce somewhat sluggish results for the S&P 500 over the next few weeks. While medium and long-term performance for the S&P 500 is solid, some of the signal dates, like 1973, 2000, and 2007, should be noted.
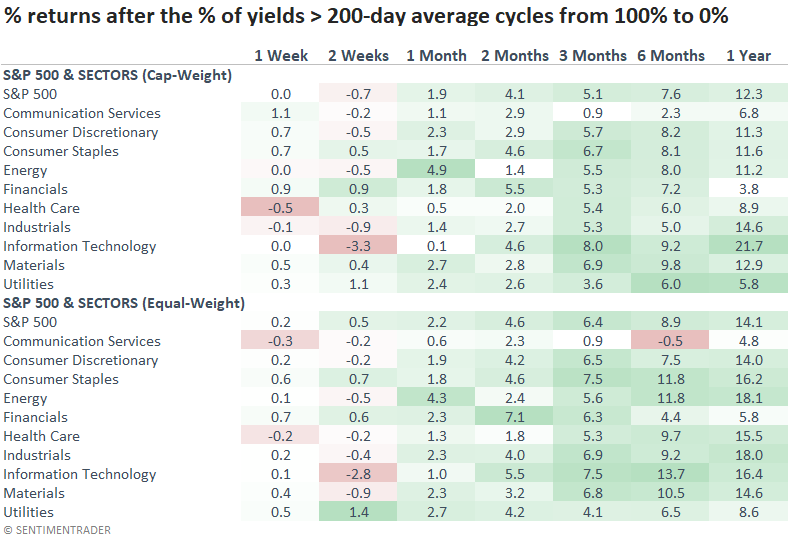
A falling rate environment does not bode well for the Financials over the next year. However, Technology, which lagged severely last year when rates were rising, could outperform if you have a long enough horizon.
How did the signals perform during a rising rate environment
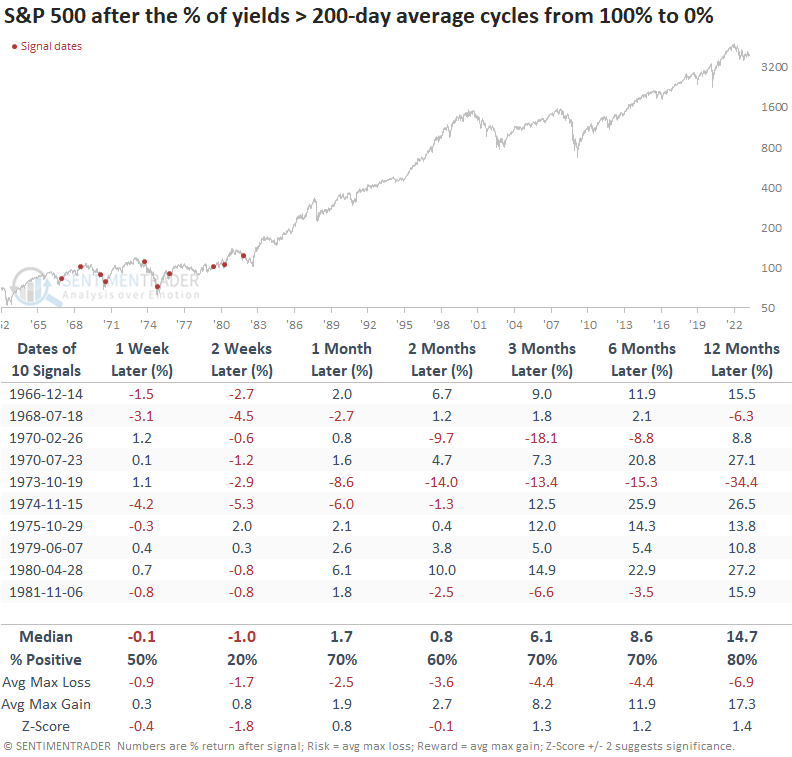
When I isolate the signals for stocks during the 1966-82 period, the first couple of weeks shows a more pronounced tendency toward unfavorable results. At some point during that time frame, the S&P 500 declined in 9 out of 10 instances. Despite a rising rate environment, the long-term results still look solid.
The performance of the Financials sector during the rising rate environment of 1966-82 is stunning compared to the entire study period, which included a long secular decline in rates. And, as we saw last year, Technology can struggle in the near term when rates are rising.
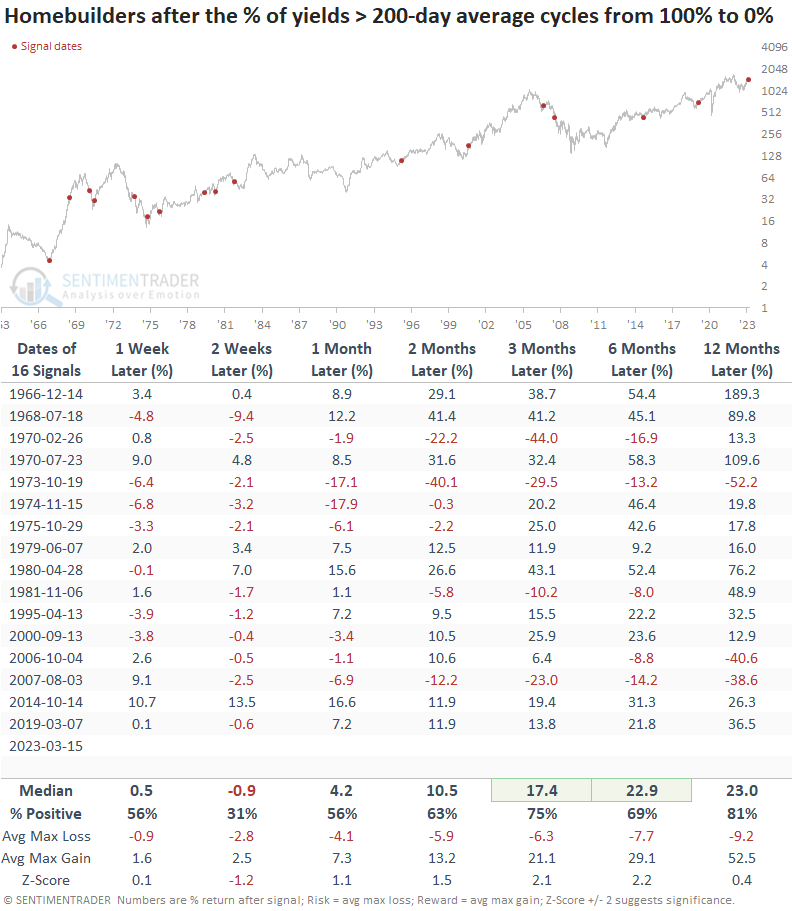
What about an interest rate-sensitive group like homebuilders
Homebuilders have been one of the best-performing groups since June of 2022. Suppose rates ease as the trend reversal signal suggests. In that case, the builders could continue outperforming if the broad market avoids a scenario like 1973-74 or 2007-08.
What the research tells us...
Interest rates increased at one of the fastest paces in history over the last 14 months. The recent shift in Treasury yields from above to below their respective 200-day averages could be a market message that the rate environment is turning more favorable. After similar changes, interest rates tend to decline further, benefiting stocks across medium and long-term horizons. The tricky part is determining whether the shot across the bow is a warning that the economy is heading toward a hard landing. Given the challenging market backdrop, holding some additional cash in a 1-year T-Bill seems appropriate.