Yield Curve Inversion; Intense Selling; November Flows

This is an abridged version of our Daily Report.
Upside down
The yields on 2- and 3-year Treasuries are now higher than 5-year maturities, an inversion of the short end of the yield curve.
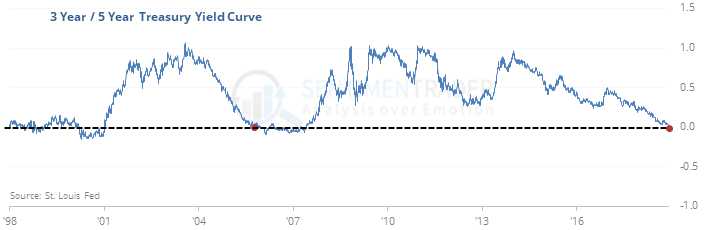
This tends to precede an inversion of the more common 2-year vs 10-year yields. But there has been a long lead time between an inversion on the short end of the curve and a recession, and an even longer lead time before a market peak.
Forward returns in the S&P 500 (and most sectors) were good after the short end inverted. The S&P’s return when the short end inverted for the first time in a year averaged 6.6% over the next two months and was positive 5 out of 6 times.
Vicious selling
The selling pressure on Tuesday was matched only by February 5 of this year. Volume flowing into advancing stocks was below 7% and the Arms Index shows just how skewed that was relative to the percentage of stocks that rose.
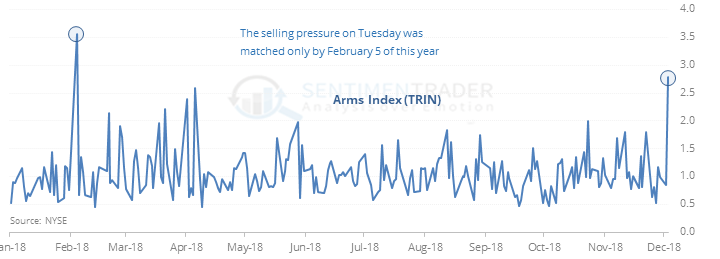
Other days with just lopsided pressure saw generally rising prices, especially when excluding 2007. Returns over the next 2-12 weeks were significantly above random, and the risk/reward was skewed positive. Most of the risk over the next year was focused in the first month.
November flow
Traders yanked a significant amount of money from technology-focused ETFs in November, as well as broad-based commodity funds. They were much more positive on health care and emerging market stocks, as well as bond funds.
Jumpy
The VIX jumped 4 points on Tuesday but still closed below 21. That has happened on 14 other days since 1990.