Products
SentimenTrader Trading Tools
‍
Backtest Engine
My Trading Toolkit
Correlation Analysis
Seasonality
Market Prediction
Indicators & Data API
‍
Proprietary Indicators & Charts
Market Data API
Strategies & Scanner
‍
50+ Trading Strategies
Smart Stock Scanner
Smart Option Scanner
Research Reports
‍
Research Solutions
Reports Library
Free Resources
Simple Backtest Calculator
Simple Seasonality Calculator
The Kelly Criterion Calculator
Sentiment Geo Map
Public Research Reports
Education
Sentiment Indicators
Technical Indicators
Pricing
Company
About
In the News
Testimonials
Client Success Stories
Contact
Log inLoginSign up
< BACK TO ALL REPORTS

Yield curve collapse suggests near term caution

Dean Christians
2021-12-06
The 10's vs. 2's yield curve spread declined by the largest amount in a decade over the last 7 -days. Similar behavior in the curve preceded weak short-term returns for stocks.

Key points:

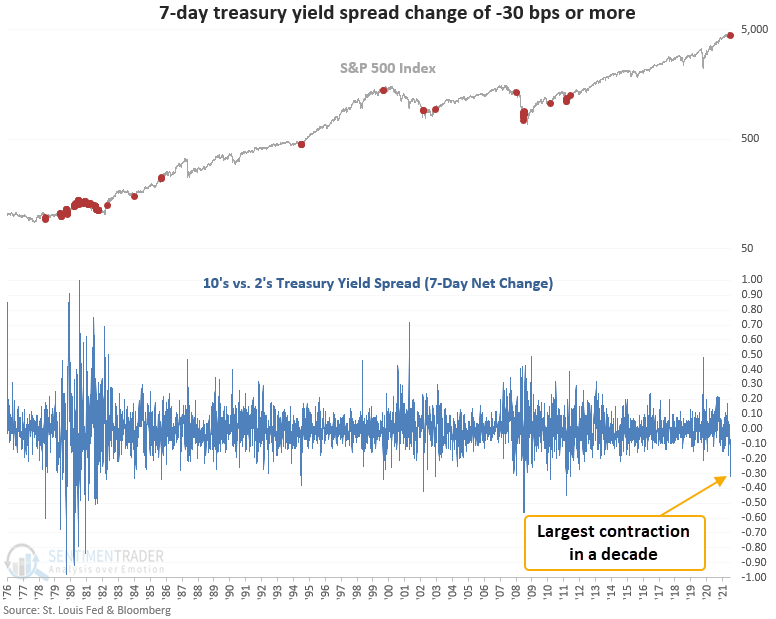
  • The 10's vs. 2's treasury yield spread has declined by 32 bps
  • The sharp drop in the spread occurred over only the last 7 sessions
  • Similar conditions preceded negative returns in the S&P 500 from 1-4 weeks later

A proxy for investor sentiment on the direction of the economy

When the 10's vs. 2's treasury yield spread declines, the yield curve is said to be "flattening." Typically, a flattening of the yield curve suggests softer economic conditions.

Conversely, when the 10's vs. 2's treasury yield spread increases, the yield curve is said to be "steepening." A steepening of the yield curve is typically, but not always, associated with more robust economic conditions.

What happens when the yield curve flattens by a meaningful amount

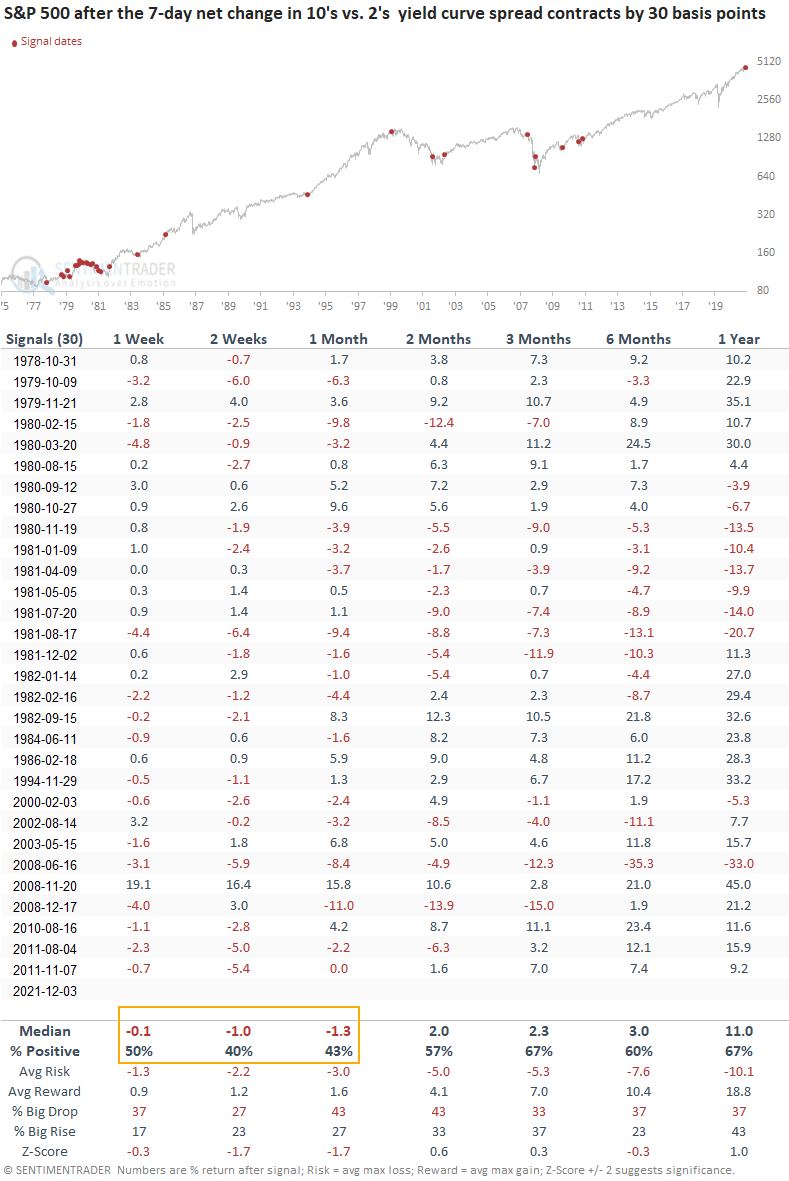
Let's assess the outlook for the stock market when the 7-day net change in the 10's versus 2's treasury yield spread falls by 30 basis points or more. 

Significant declines in the treasury yield spread in a brief period are typically associated with growth scare corrections and bear markets.

Similar signals preceded weak returns in the near term

This signal triggered 30 other times over the past 44 years. After the others, future returns and win rates were weak over the next 1-4 weeks. If we look at the returns post the peak in interest rates in 1981, we see negative returns at some point in the first 2 weeks in 13 out of 16 instances. 

Returns after a flattening, but positive, curve

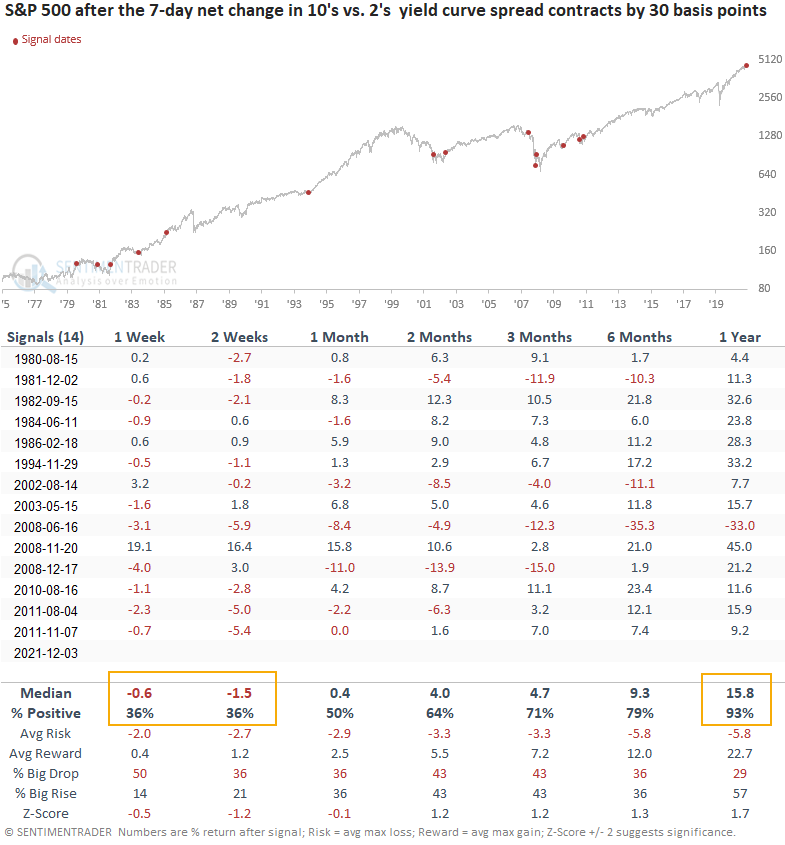
Let's add some context to the study. I will keep the original parameters but now isolate historical instances when the treasury yield spread was positive, which is the case now. The spread currently resides at +75 bps.

This signal triggered 14 other times over the past 42 years. After the others, future returns and win rates were weak on a short-term basis, with negative returns at some point in 12 out of 14 instances in the first 2 weeks. However, when the yield curve spread was positive, the S&P rose over the next year after 13 out of 14 signals.

Returns after a flattening, but positive, curve during an uptrend

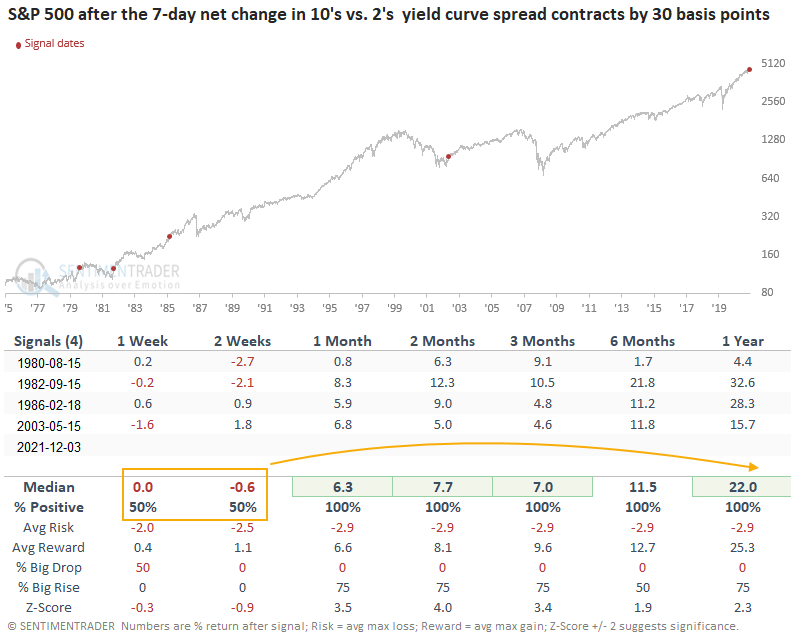
Let's add even more context to the study. I will keep the previous conditions and now include a trend filter. The S&P 500 must be trading above its 200-day moving average, which is the case now.

This signal triggered only 4 other times over the past 42 years. After the others, future returns and win rates suggest a 1-2 week pause. After the initial pause, results are undefeated across all time frames. The sample size is tiny, though, so that's always a caveat.

What the research tells us...

When the 10's vs. 2's yield curve spread registers a sharp decline over the trailing 7 day period, investor sentiment on the economy turns cautious, and stocks take a pause. Similar setups to what we're seeing now have preceded weak returns and win rates in the near term. However, when the yield curve spread is positive, and the S&P 500 is trading above its 200-day average, it's a pause that refreshes a bullish trend.

PRODUCTS
SentimenTrader
Trading Tools
Indicators & Data API
‍
Strategies & Scanner
‍
Research Reports
FREE
RESOUrCES
Simple Backtest
Calculator
Simple Seasonality
Calculator
The Kelly Criterion
Calculator
Sentiment Geo Map
‍
Public Research Reports
‍
Education
Sentiment Indicators
‍
Technical Indicators
‍
Pricing
Bundle pricing
‍
FAQ
‍
Announcements
‍
COMPANY
‍
About
‍
In the News
‍
Testimonials
‍
Client Success Stories
CONTACT
‍
General Inquiries
‍
Media Inquiries
‍
Financial Professionals Inquiries
‍
© 2026 Sundial Capital Research Inc. All rights reserved.
Setsail Marketing
TermsPrivacyAffiliate Program
Risk Disclosure: The information and tools provided are for research and analytical purposes only and are not intended as investment advice. Market analysis involves uncertainty, and outcomes may differ from expectations. Users should conduct their own due diligence and consider their individual circumstances before making any financial decisions. Past performance is not necessarily indicative of future results.

Hypothetical Performance Disclosure: Hypothetical performance results have many inherent limitations, some of which are described below. No representation is being made that any account will or is likely to achieve profits or losses similar to those shown; in fact, there are frequently sharp differences between hypothetical performance results and the actual results subsequently achieved by any particular trading program. One of the limitations of hypothetical performance results is that they are generally prepared with the benefit of hindsight. In addition, hypothetical trading does not involve financial risk, and no hypothetical trading record can completely account for the impact of financial risk of actual trading. for example, the ability to withstand losses or to adhere to a particular trading program in spite of trading losses are material points which can also adversely affect actual trading results. There are numerous other factors related to the markets in general or to the implementation of any specific trading program which cannot be fully accounted for in the preparation of hypothetical performance results and all which can adversely affect trading results.

Testimonial Disclosure: Testimonials appearing on this website may not be representative of other clients or customers and is not a guarantee of future performance or success.