Products
SentimenTrader Trading Tools
‍
Backtest Engine
My Trading Toolkit
Correlation Analysis
Seasonality
Market Prediction
Indicators & Data API
‍
Proprietary Indicators & Charts
Market Data API
Strategies & Scanner
‍
50+ Trading Strategies
Smart Stock Scanner
Smart Option Scanner
Research Reports
‍
Research Solutions
Reports Library
Free Resources
Simple Backtest Calculator
Simple Seasonality Calculator
The Kelly Criterion Calculator
Sentiment Geo Map
Public Research Reports
Education
Sentiment Indicators
Technical Indicators
Pricing
Company
About
In the News
Testimonials
Client Success Stories
Contact
Log inLoginSign up
< BACK TO ALL REPORTS

Yet another encouraging signal for the technology sector

Dean Christians
2025-07-10
The proportion of technology stocks in a bear market recently completed a dramatic reversal, cycling from one of the most extreme readings in history to a bullish level. Similar recoveries saw the S&P 500 technology sector rally 100% of the time over five, six, and twelve months.

Key points: 

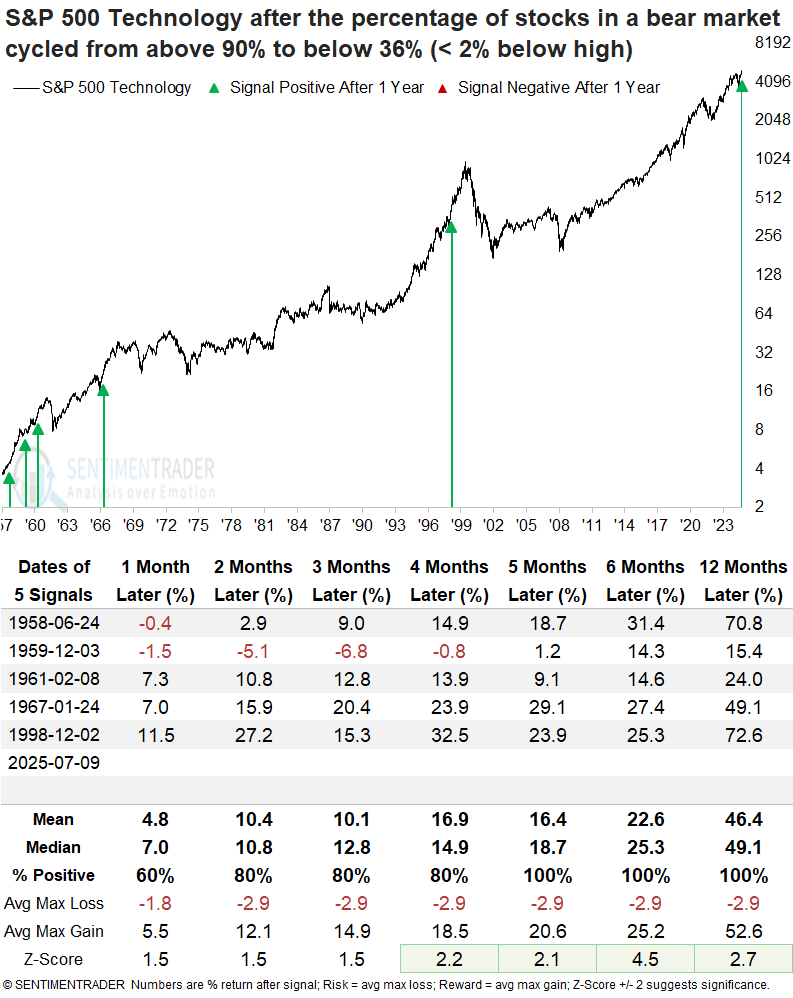
  • The percentage of S&P 500 Technology stocks in a bear market recovered from an extreme reading
  • Following comparable turnarounds, the tech sector posted gains a year later every time
  • Large-cap technology consistently outperformed the S&P 500 from one to twelve months later 

Technology stocks roar back to life from the depths of a bear market

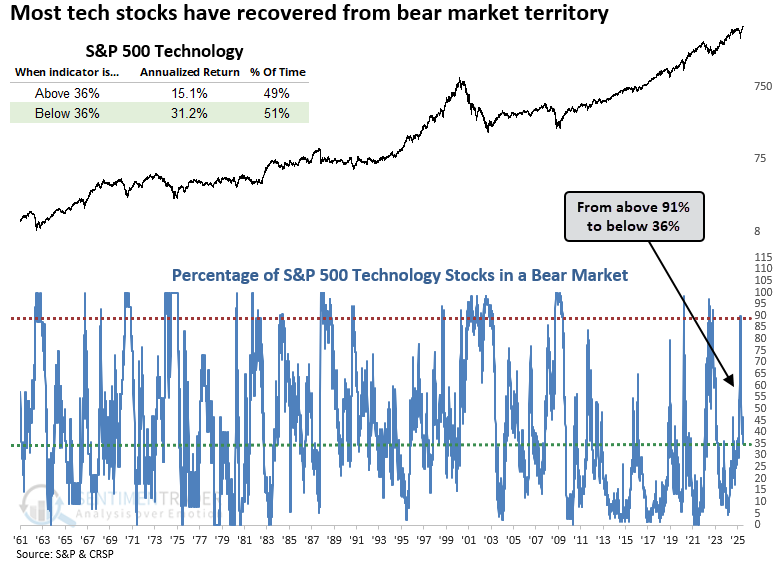
During the depths of the Liberation Day meltdown, the S&P 500 Technology sector experienced severe internal damage, with 91% of its constituents falling into a bear market, defined as a decline of 20% or more from a 252-day high. However, in the months since, the proportion of stocks in a bear market has sharply reversed, collapsing below 36%, a critical level that signals a favorable backdrop for the group.

As shown in the chart below, the technology sector posts an impressive 31% annualized return when fewer than 36% of its stocks are in a bear market, more than double the return observed when this threshold is exceeded. 

Similar recoveries preceded outstanding returns for the tech sector

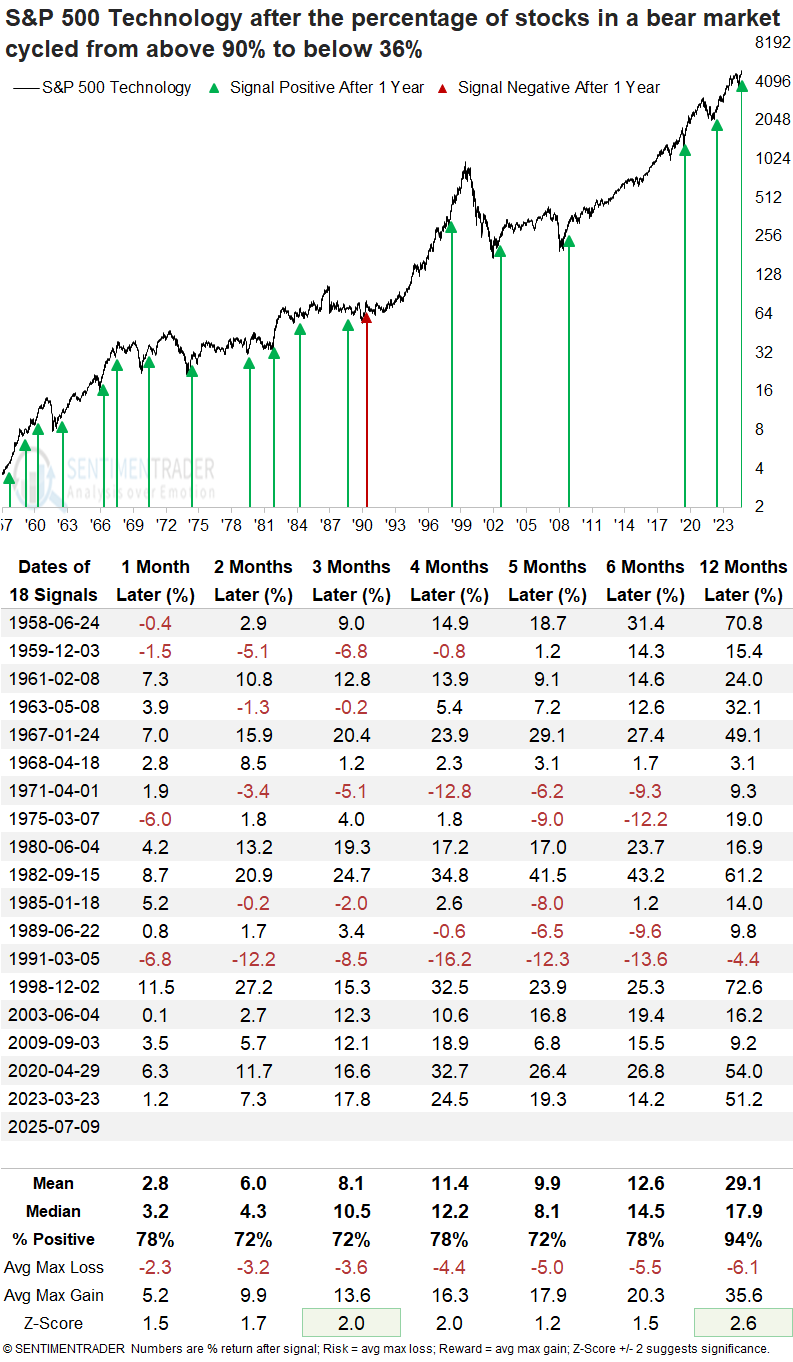
Whenever the percentage of S&P 500 Technology sector stocks in a bear market transitioned from above 90% to below 36%, the sector displayed remarkable consistency and outsized returns. Furthermore, several time frames exhibited significance relative to random expectations.  

A year later, the group was higher in every case except 1991, a period marked by a challenging stretch for technology, which remained range-bound from late 1987 through early 1994.

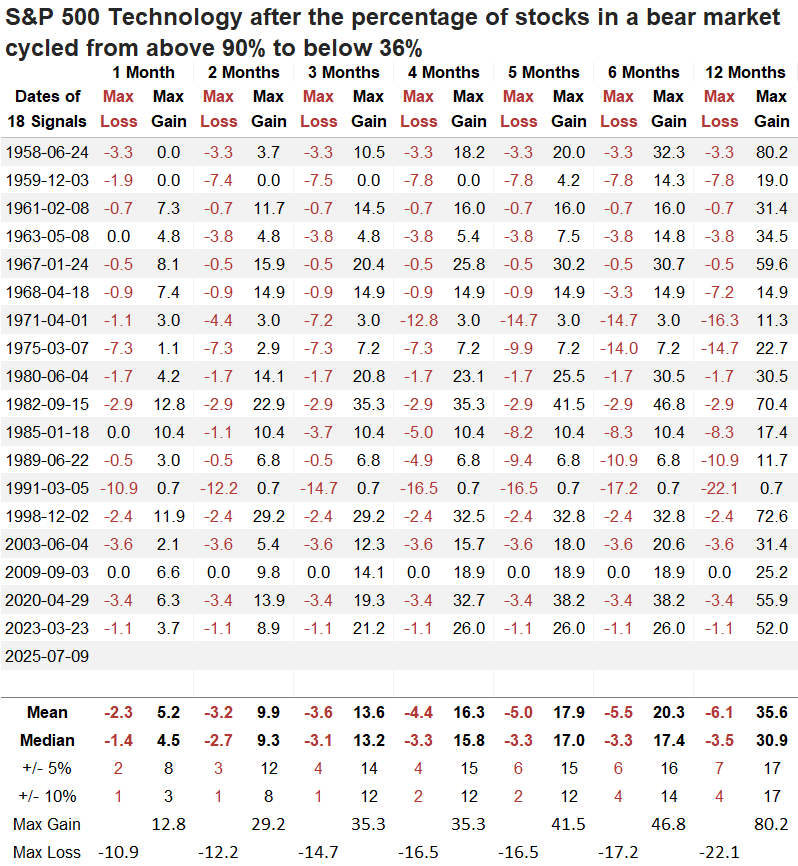
Over the following year, the S&P 500 Technology sector experienced declines of more than 10% on four occasions, while it rose by more than 10% in 17 instances, indicating a favorable risk/reward scenario.

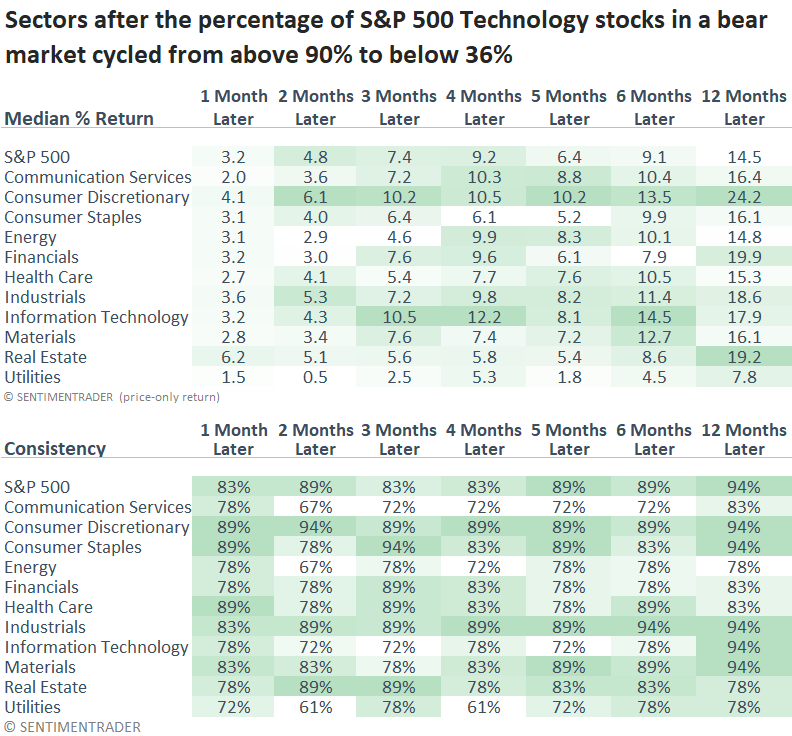
Technology outperformed the S&P 500 in every measured period except the two-month span, where it lagged slightly by 0.46%. Consistent with historical tendencies, offensive sectors, most notably consumer discretionary, led the broader market. 

Signals near a high

Although the sample size is small, when a signal occurred within 2% of an all-time high, the tech sector was higher 100% of the time, five, six, and twelve months later.

What the research tells us...

At the worst point in April, over 91% of S&P 500 Technology sector stocks were down 20% or more from their respective highs, reflecting widespread pessimism and capitulation. Subsequently, the group has staged a remarkable recovery, with fewer than 36% of the stocks in a bear market. Similar transitions of this magnitude have led to a rally in the technology sector 94% of the time, a year later, and in every instance when the signal occurred near a high. Furthermore, technology stocks have consistently outpaced the broader market, reinforcing the case for investors to maintain an overweight position in the sector. While profit-taking or tariff headlines may cause temporary setbacks for tech stocks, the big-picture outlook remains compelling, especially given the AI backdrop.

PRODUCTS
SentimenTrader
Trading Tools
Indicators & Data API
‍
Strategies & Scanner
‍
Research Reports
FREE
RESOUrCES
Simple Backtest
Calculator
Simple Seasonality
Calculator
The Kelly Criterion
Calculator
Sentiment Geo Map
‍
Public Research Reports
‍
Education
Sentiment Indicators
‍
Technical Indicators
‍
Pricing
Bundle pricing
‍
FAQ
‍
Announcements
‍
COMPANY
‍
About
‍
In the News
‍
Testimonials
‍
Client Success Stories
CONTACT
‍
General Inquiries
‍
Media Inquiries
‍
Financial Professionals Inquiries
‍
© 2026 Sundial Capital Research Inc. All rights reserved.
Setsail Marketing
TermsPrivacyAffiliate Program
Risk Disclosure: The information and tools provided are for research and analytical purposes only and are not intended as investment advice. Market analysis involves uncertainty, and outcomes may differ from expectations. Users should conduct their own due diligence and consider their individual circumstances before making any financial decisions. Past performance is not necessarily indicative of future results.

Hypothetical Performance Disclosure: Hypothetical performance results have many inherent limitations, some of which are described below. No representation is being made that any account will or is likely to achieve profits or losses similar to those shown; in fact, there are frequently sharp differences between hypothetical performance results and the actual results subsequently achieved by any particular trading program. One of the limitations of hypothetical performance results is that they are generally prepared with the benefit of hindsight. In addition, hypothetical trading does not involve financial risk, and no hypothetical trading record can completely account for the impact of financial risk of actual trading. for example, the ability to withstand losses or to adhere to a particular trading program in spite of trading losses are material points which can also adversely affect actual trading results. There are numerous other factors related to the markets in general or to the implementation of any specific trading program which cannot be fully accounted for in the preparation of hypothetical performance results and all which can adversely affect trading results.

Testimonial Disclosure: Testimonials appearing on this website may not be representative of other clients or customers and is not a guarantee of future performance or success.